


On 16th May (Thursday), before market open, one of the behemoths of the retail trade sector – Walmart – shall report its earnings result for the fiscal quarter ending April 2024 Walmart operates a chain of hypermarkets, discount department stores and grocery stores. By market capitalization in the global retail sector, Walmart is ranked 2nd ($486B), right after Amazon.
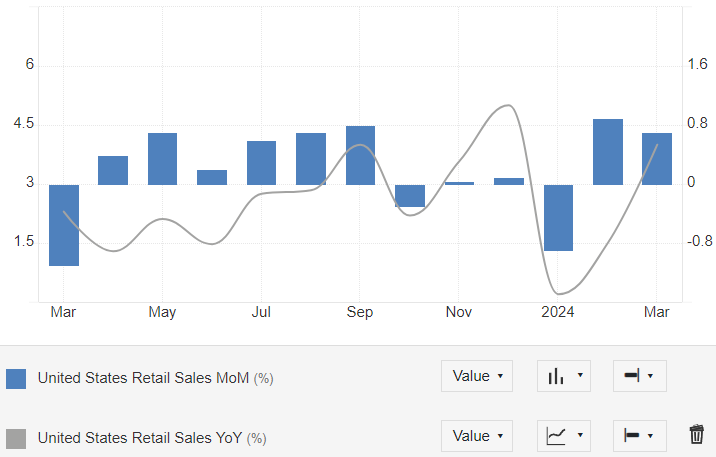
US Retail Sales. Source: Trading Economics
The latest US retail sales data reported an increase of 4% (y/y) in March 2024, which is subpar of the average figure 4.8% from 1993 until 2024. It rose 0.7% (m/m), following an upwardly revised 0.9% gain in February, suggesting a still-robust consumer spending. Categories that posted increases in sales include non-store retailers (2.7%), gasoline stations (2.1%), miscellaneous store retailers (2.1%), building materials and garden equipment (0.7%), food and beverages stores (0.5%), health and personal care stores (0.4%), food services and drinking places (0.4%). On the contrary, categories that reported losses in sales include sporting goods, musical instrument and book stores (-1.8%), clothing (-1.6%), electronic appliances (-1.2%), general merchandise stores (-1.15), autos (-0.9%) and furniture (-0.3%).
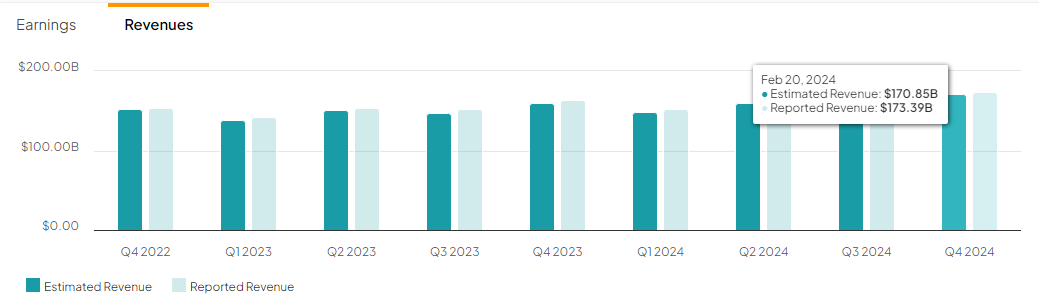
Walmart: Revenues & Earnings (After Deduction of Tax and Expenses). Source: Tipranks
Key financial metrics of Walmart remained solid in the previous quarter. Sales revenue were up 5.7% (y/y) to $173.4B.
The company continued to see robust growth both in-store and digitally. In the US, the company saw strength in grocery and health & wellness, while general merchandise sales declined modestly; whereas its international sales were mainly led by Flipkart, Walmex and China, helped by strong growth of festive events. E-commerce in the US has seen 17% (y/y) in sales growth, led by strength in pickup and delivery, whereas internationally the segment has seen gains of 44% (y/y), led by marketplace and omnichannel offerings, as well as penetration up across markets. Throughout FY 2024, the company’s eCommerce sales have surpassed $100 billion globally.
In addition, a division of Walmart – Sam’s Club (paid membership based warehouse, which sells groceries and household items in bulk amounts) – reported net sales up 2.0% (y/y), led by food and consumables, as well as increases in transactions and unit volumes. The division also reported 17% sales growth in e-commerce, led by curbside and delivery. Besides that, growth in membership income remains robust, up 10% from the year ago period.
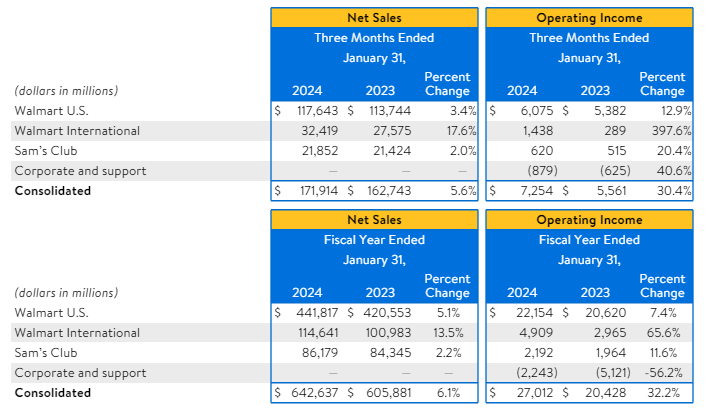
Walmart: Net Sales and Operating Income. Source: Walmart Earnings Report
Operating income was up over +30% (y/y) to $7.3B. By business segments, main contribution came from Walmart International which saw a huge leap of nearly 400% (y/y) at $1.44B. Sam’s Club reported fair gains of 20.4% (y/y) to $620 million. Walmart US contributed the most at $6.08B. Corporate and support has seen losses at -$879 million, previously -$625 million. Throughout FY 2024, Walmart reported net sales at $642.6B while operating income at $27.0B. Both were up 6.1% and up 32.2% from the year ago period, respectively.
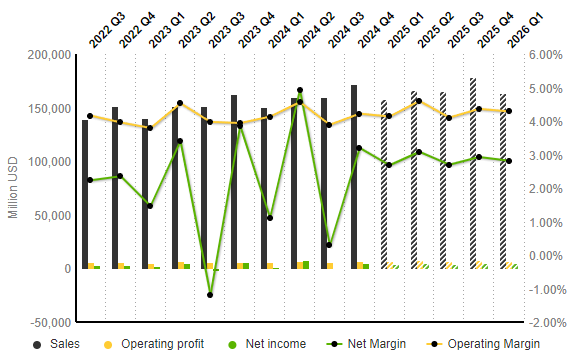
Walmart: Income Statement Evolution (Quarterly Data). Source: Market Screener
According to projections by S&P Global Market Intelligence, sales revenue is expected to reach $158B in the coming quarter, down over -8% from the previous quarter, but up 4.6% from the same period last year. Operating profit and net income are projected lower from the previous quarter, to $6.53B and $4.23B respectively. This would lead to net margin down by -0.52% from the previous quarter, to 2.68%. Operating margin is also expected to be down slightly from the previous quarter, to 4.13%.
Technical Analysis:
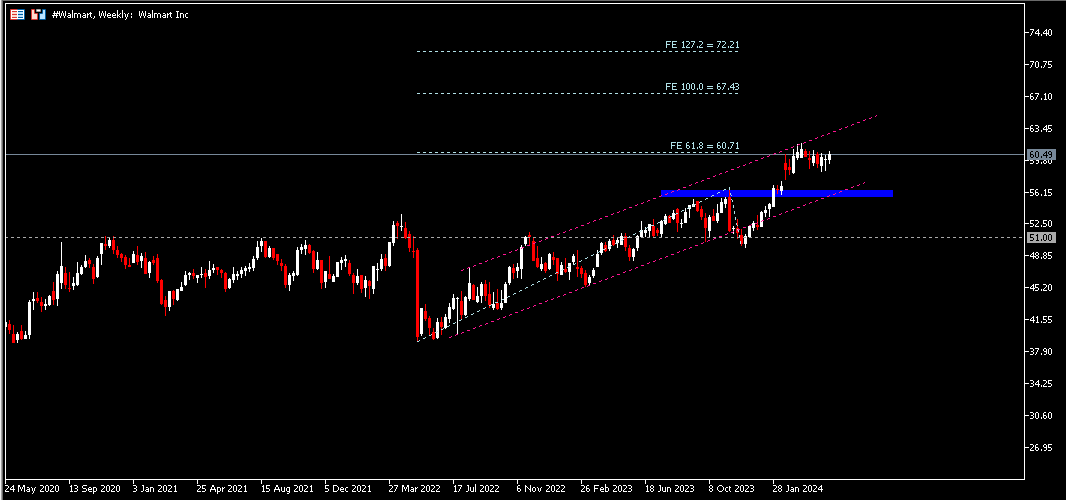
#Walmart share price remains traded in consolidation, testing resistance at $60.70 (FE 61.8%). The upper line of the ascending channel also serves as the next resistance to watch, in which a strong break above this line may encourage the bulls to continue testing $67.40 (FE 100.0%). Otherwise, the lower line of the ascending channel and the blue zone $55.50 – $56.50 serve as the nearest support, followed by $51, a solid resistance-turned-support level.
Click here to access our Economic Calendar
Larince Zhang
Market Analyst
Disclaimer: This material is provided as a general marketing communication for information purposes only and does not constitute an independent investment research. Nothing in this communication contains, or should be considered as containing, an investment advice or an investment recommendation or a solicitation for the purpose of buying or selling of any financial instrument. All information provided is gathered from reputable sources and any information containing an indication of past performance is not a guarantee or reliable indicator of future performance. Users acknowledge that any investment in Leveraged Products is characterized by a certain degree of uncertainty and that any investment of this nature involves a high level of risk for which the users are solely responsible and liable. We assume no liability for any loss arising from any investment made based on the information provided in this communication. This communication must not be reproduced or further distributed without our prior written permission.


