The Walt Disney Co., a diversified international family entertainment and media enterprise founded in 1923, shall release its Q3 2023 earnings result on 9th August (Wednesday), after market close. The company operates via two main segments: Disney Media and Entertainment Distribution (DMED) and Disney Parks, Experiences and Products (DPEP). The former covers the company’s global film, television content production and distribution activities, while the latter encompasses parks and experiences and consumer products.
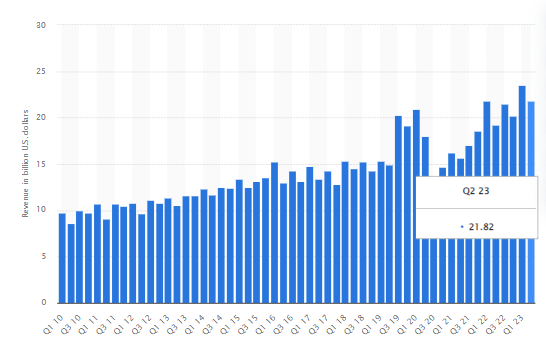
Walt Disney generated $21.8B revenue in Q2 2023, down -7.19% from the previous quarter, but up 13.35% from the same period last year. According to the official report, $7.8B revenue was generated from the Disney Parks segment, up nearly 17% from the same period last year. This also brings about its segment operating income being up 23% (y/y) to $2.2B. Domestically, the Disney Cruise Line and Disneyland Resort reported growth in the number of passengers and guest spending, slightly offset by increased operational cost.
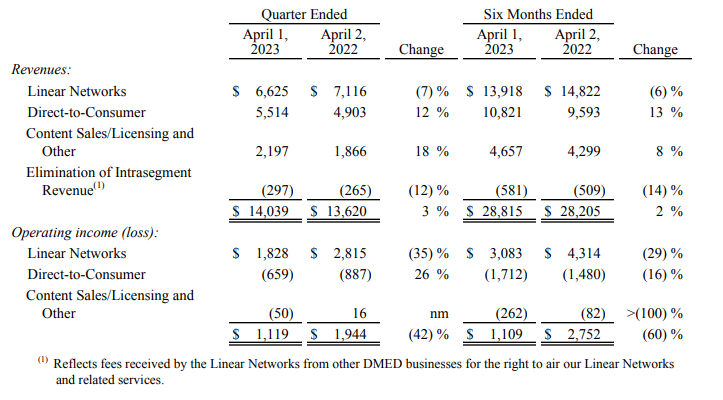
On the contrary, the company’s Media and Entertainment Distribution generated 3% (y/y) in revenue for the quarter to $14.04B. By segment, Direct-to-Consumer and Content Sales/Licensing and Other reported gains of +12% (y/y) and 18% (y/y) respectively, to $5.51B and $2.20B; Linear Networks reported losses of -7% (y/y) to $6.63B. Total operating income was down -42% (y/y) to $1.12B, mainly driven by continuing losses (-35% (y/y) in Linear Networks.
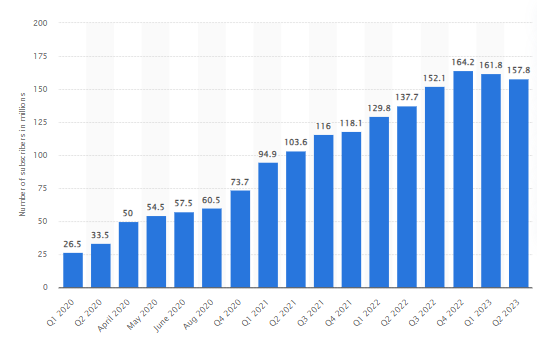
The company reported losses in Disney+ paid subscribers for two consecutive quarters, to 157.8 million. For its other DTC products, ESPN+ subscribers increased 2% (q/q) to 25.3 million, whereas Hulu subscribers were up 0.2 million from the previous quarter to 48.2 million. Nonetheless, it is worth noting that the management may potentially sell off its traditional TV and cable businesses (ESPN, Freeform, ABC) as the company is in the middle of a transition to streaming. The company may place utmost importance in improving its streaming segment (which incurred operational losses of -1.7B in H1 2023) in the coming quarters, and expected profitability by the end of FY 2024.
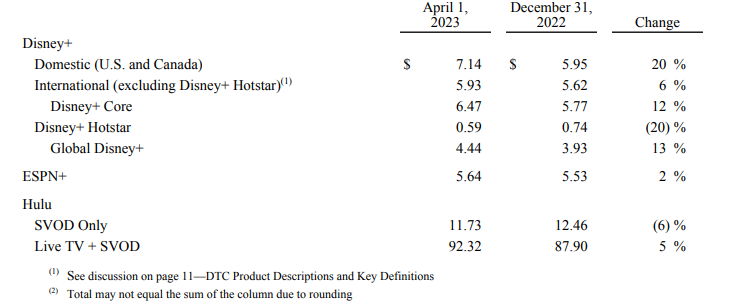
In terms of average monthly revenue per paid subscriber, Disney+ reported gains for both Domestic and International (excluding Disney+ Hotstar), at 20% and 6% respectively to $7.14 and $5.93. Domestic gains were contributed to by an increase in average retail pricing, whereas International gains were boosted by an increase in wholesale pricing, a lower mix of wholesale subscribers and a favourable foreign exchange impact. Disney+ Hotstar suffered losses due to a reduction in advertising revenue per subscriber.
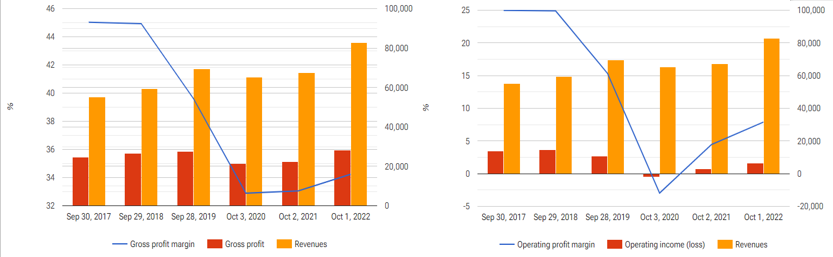
In FY 2022, gross profit margin of Walt Disney was 34.24%. After taking out operating expenses and overhead, the company earned 7.90% in operating profit margin. The result is better than FY 2021 (4.46%) and FY 2020 (-2.97%), albeit still far below pre-pandemic levels.
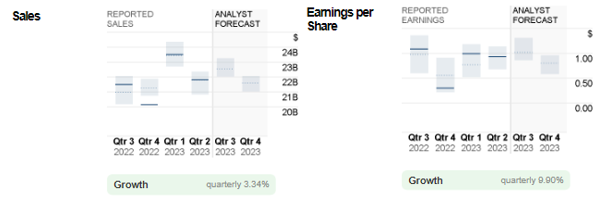
Consensus estimates for sales in the coming announcement hit $22.5B, up 3.2% from the previous quarter, and 4.7% from the same period last year. EPS is expected to improve from $0.93 in the previous quarter to $1.02, still 7 cents below Q3 2022.
Technical Analysis:
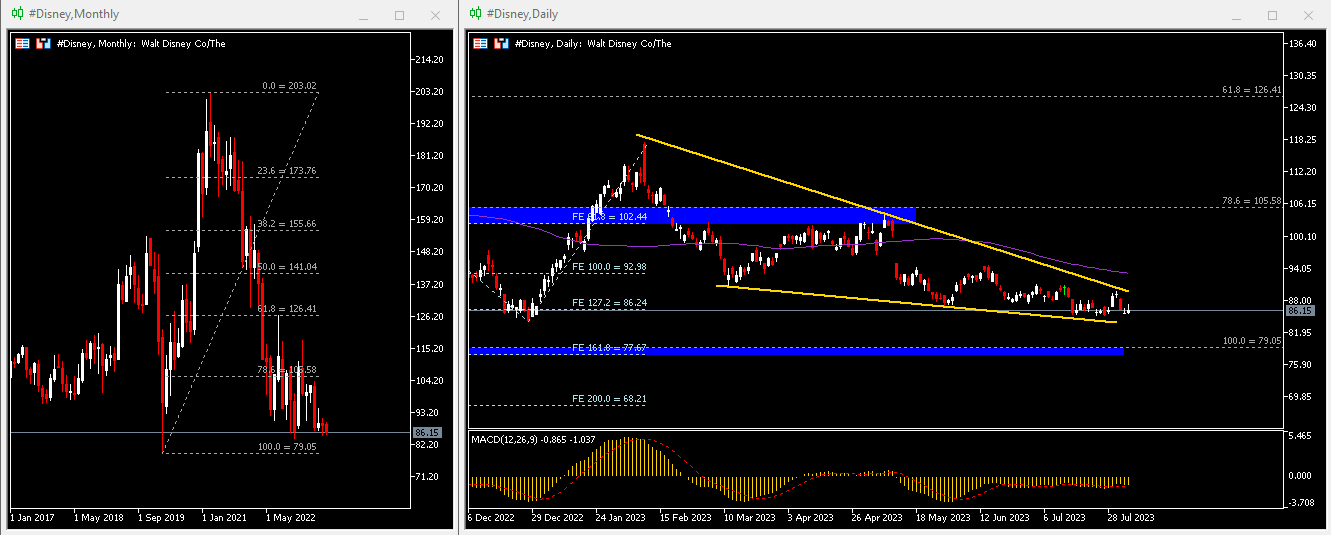
The #Disney share price has been riding on a bearish trend for nearly 2.5 years, leaving an ATH at $203 in March 2021. The daily chart shows that the company’s share price is being traded within a descending wedge. The upper line of the wedge and the 100-day SMA (that intersects with FE 100.0% at $93) are the nearest resistance to watch. Otherwise, the bottom line of the wedge and $86 (FE 127.2%) serve as the nearest support. Breaking these levels may encourage more selling pressure, towards the next support area $77.50-$79. The MACD indicator has remained in negative configuration for nearly 3 months.
Click here to access our Economic Calendar
Larince Zhang
Market Analyst
Disclaimer: This material is provided as a general marketing communication for information purposes only and does not constitute an independent investment research. Nothing in this communication contains, or should be considered as containing, an investment advice or an investment recommendation or a solicitation for the purpose of buying or selling of any financial instrument. All information provided is gathered from reputable sources and any information containing an indication of past performance is not a guarantee or reliable indicator of future performance. Users acknowledge that any investment in Leveraged Products is characterized by a certain degree of uncertainty and that any investment of this nature involves a high level of risk for which the users are solely responsible and liable. We assume no liability for any loss arising from any investment made based on the information provided in this communication. This communication must not be reproduced or further distributed without our prior written permission.