


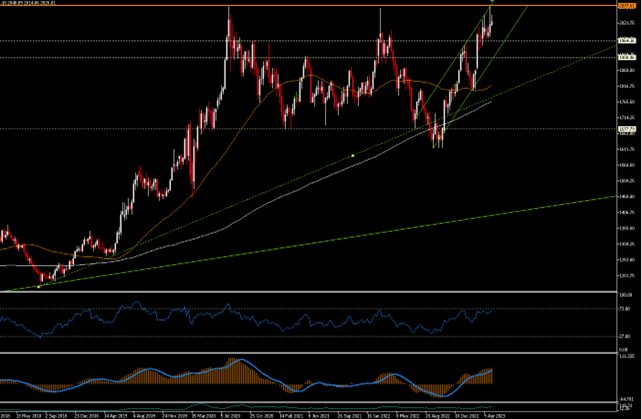
Gold has tested $2075/oz 3 times in the last 20 months, with the last one on Wednesday, 3rd May, which may suggest a triple top has set in.
There is something strange in gold’s behaviour lately, at least in our eyes. If one were to find a strong correlation with another factor, it would be with US real interest rates (nominal – prices), of which TIPS (Treasury Inflation Protected Securities) are a good proxy. To simplify: gold yields nothing, indeed physically storing it has various costs (security, insurance, transport, etc.). But when even real rates are close to zero – or even negative – it is still a good idea to buy a safe haven even if it yields nothing. We are talking about a negative correlation.
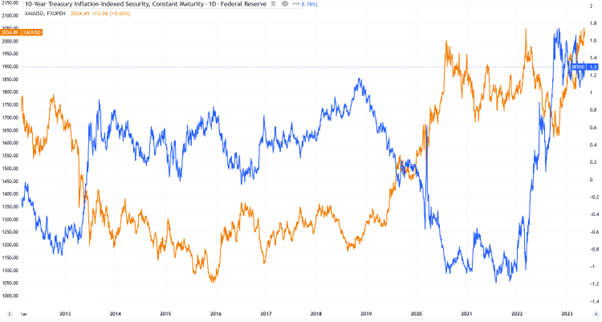
You can also see it clearly in a visual manner in the chart above: when real yields (blue) go down, the price of gold (orange) goes up. And vice versa. On a fairly regular basis.
But this has not been the case since 2020: TIPS are at 15-year highs and gold is at an all-time high. Why?
Perhaps this time the role of the central banks is again crucial in this market.
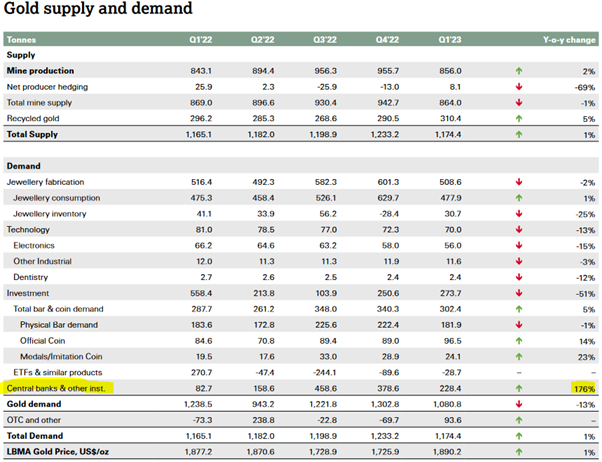
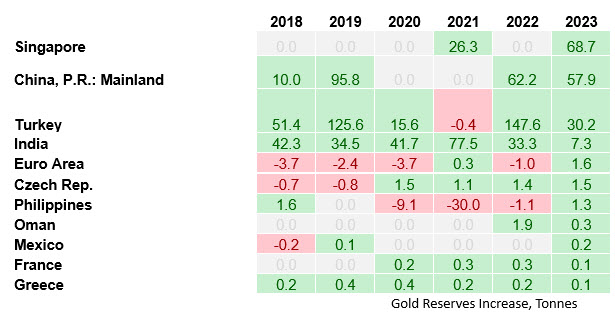
As can be seen in the chart, since Q1 2022 there has been a 176% increase in the purchases of such players, while the jewellery sector and other investors have declined substantially. And it seems that politics – be it monetary or geopolitical – played a major role. Leading the list of buyers are in fact Turkey and above all China, which has increased its reserves by 57.5 Tonnes since Q1 22.
Can such a price trend continue, pushing gold even higher?
The divergence that has occurred since the start of 2020 between TIPS and XAUUSD will need to return to more normal behavior at some point and it is challenging for TIPS, which currently stands at 1.25%, one of the highest levels since the GFC, to go much higher: a drop in them would justify a gold price at these levels and this could happen either due to a drop in nominal rates (looks like we are near the end of the tightening cycle) or due to an inflationary surprise. And then there are the central banks who seem to be powerfully back in town.
What is certain is that $2075 is an absolutely crucial level and if broken decisively it will signal the start of the next leg up, especially if indicators do not reach overbought levels. But at the moment it is close to the high end of the range of the last 2 years so – barring a breakout – we can expect lower levels which in any case would not affect the healthy long-term uptrend.
 Click here to access our Economic Calendar
Marco Turatti
Market Analyst
Disclaimer: This material is provided as a general marketing communication for information purposes only and does not constitute an independent investment research. Nothing in this communication contains, or should be considered as containing, an investment advice or an investment recommendation or a solicitation for the purpose of buying or selling of any financial instrument. All information provided is gathered from reputable sources and any information containing an indication of past performance is not a guarantee or reliable indicator of future performance. Users acknowledge that any investment in Leveraged Products is characterized by a certain degree of uncertainty and that any investment of this nature involves a high level of risk for which the users are solely responsible and liable. We assume no liability for any loss arising from any investment made based on the information provided in this communication. This communication must not be reproduced or further distributed without our prior written permission.


