USDCAD, EURCAD
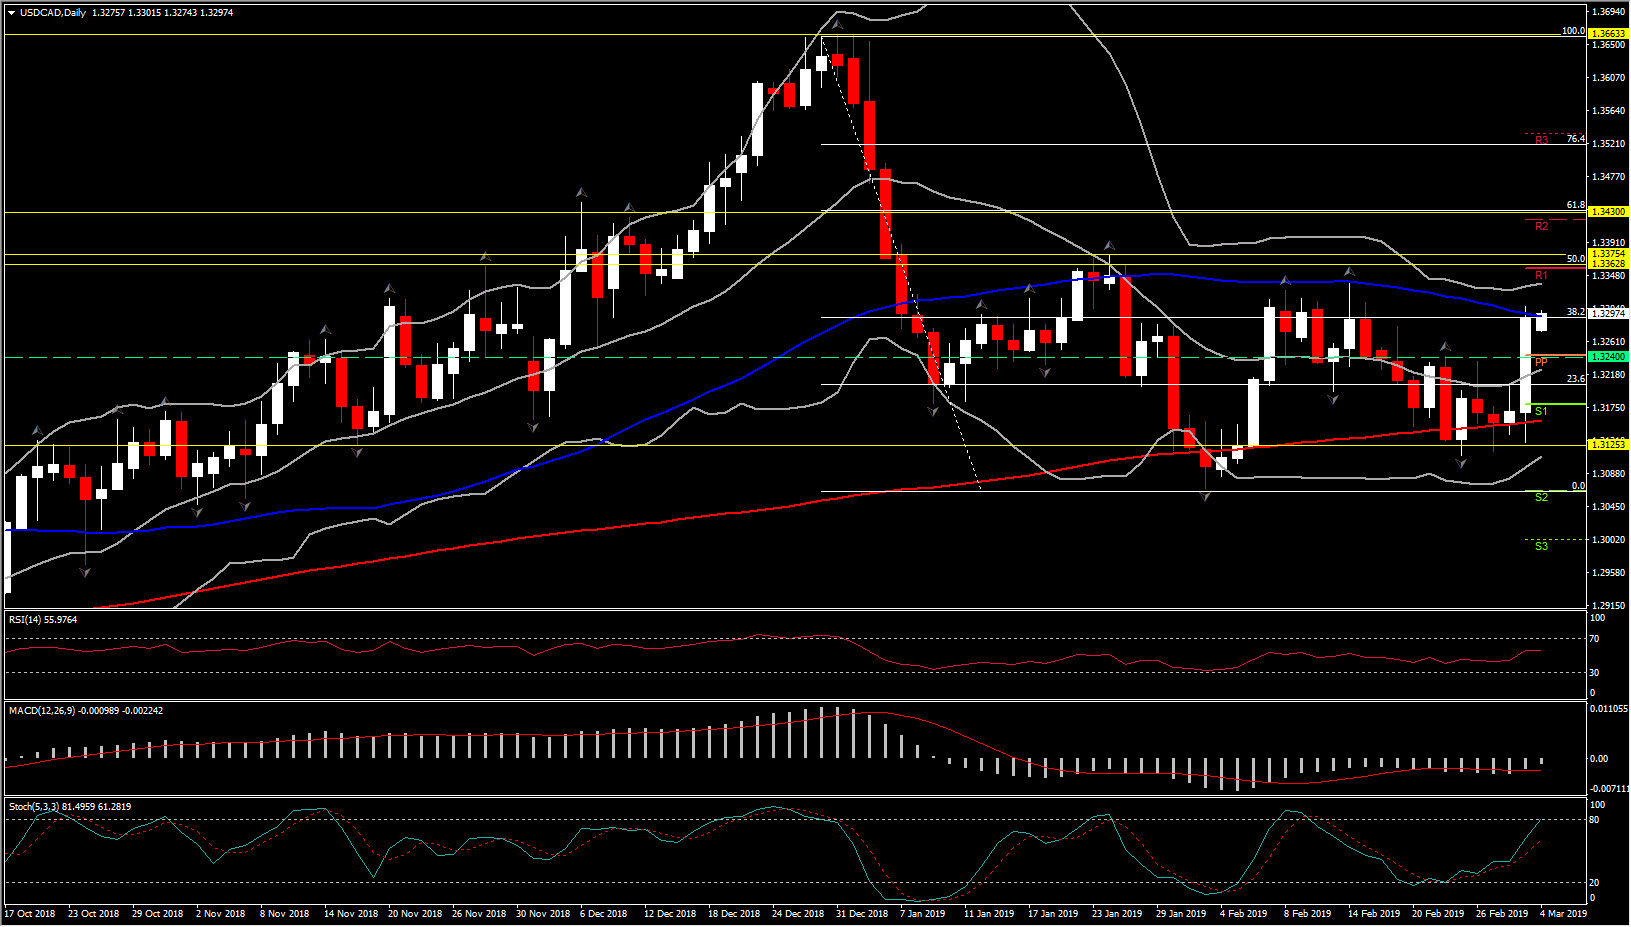
USDCAD is in consolidation mode near 1.3300 after rallying sharply after disappointing Canadian GDP data, which sent the pair to an initial peak at 1.3241, up from 1.3130. The pair later topped at 1.3306, a 2-week high, extending early gains. The second leg higher came as WTI crude tanked nearly $2/bbl to $55.58 lows. The 50-day moving average at 1.3302 was breached, which also coincides with the 38.2% Fibonacci retracement levels as shown below. Even if the asset moves northwards, this barrier remains a resistance for the asset. Only a close above it today could confirm a further upside move for the asset.
The daily technical indicators are neutral, as RSI and MACD have been flattening at 55 and close to neutral zone respectively, suggesting the continuation of the consolidation mode. This is opposed to Stochastic which is sloping higher, suggesting further upside at least in the near future. If we take a closer look at the intraday indicators, the picture is mixed again, with RSI and Stochastic flat while MACD has formed a bullish cross. Hence further northwards movement could be seen if the asset forms a strong break above Friday’s peak, in the 4-hour time frame. This scenario could lead to the retest of the next significant Resistance area at 1.3360–1.3375 (R1, 50% Fib. level and January 24 peak). Immediate Support for the day holds at 1.3270.
The outlook could turn negative only if the pair retraces more than 50% of the gains seen on Friday, i.e. if it turns lower, below the 1.3218-1.3224 area.
EURCAD, on the other hand, broke the 2-month down-channel on Friday, strengthening the up reversal scenario for the asset. Currently it remains above the 50-day EMA and below the 200-day EMA. Meanwhile, technical indicators have been improved slightly, as negative bias seems to losing ground the last 4 weeks. Intraday however the asset is turning lower, but this could just be a correction of Friday’s sharp jump. Support holds at 1.5035-1.5050 area (February 19 – confluence of 23.6% Fib. level and PP level). If the asset sustains gains above this area, then further gains could be seen, with next Resistance levels set at: 1.5130, 1.5160 and 1.5180.
Click here to access the Economic Calendar
Andria Pichidi
Market Analyst
Disclaimer: This material is provided as a general marketing communication for information purposes only and does not constitute an independent investment research. Nothing in this communication contains, or should be considered as containing, an investment advice or an investment recommendation or a solicitation for the purpose of buying or selling of any financial instrument. All information provided is gathered from reputable sources and any information containing an indication of past performance is not a guarantee or reliable indicator of future performance. Users acknowledge that any investment in FX and CFDs products is characterized by a certain degree of uncertainty and that any investment of this nature involves a high level of risk for which the users are solely responsible and liable. We assume no liability for any loss arising from any investment made based on the information provided in this communication. This communication must not be reproduced or further distributed without our prior written permission.