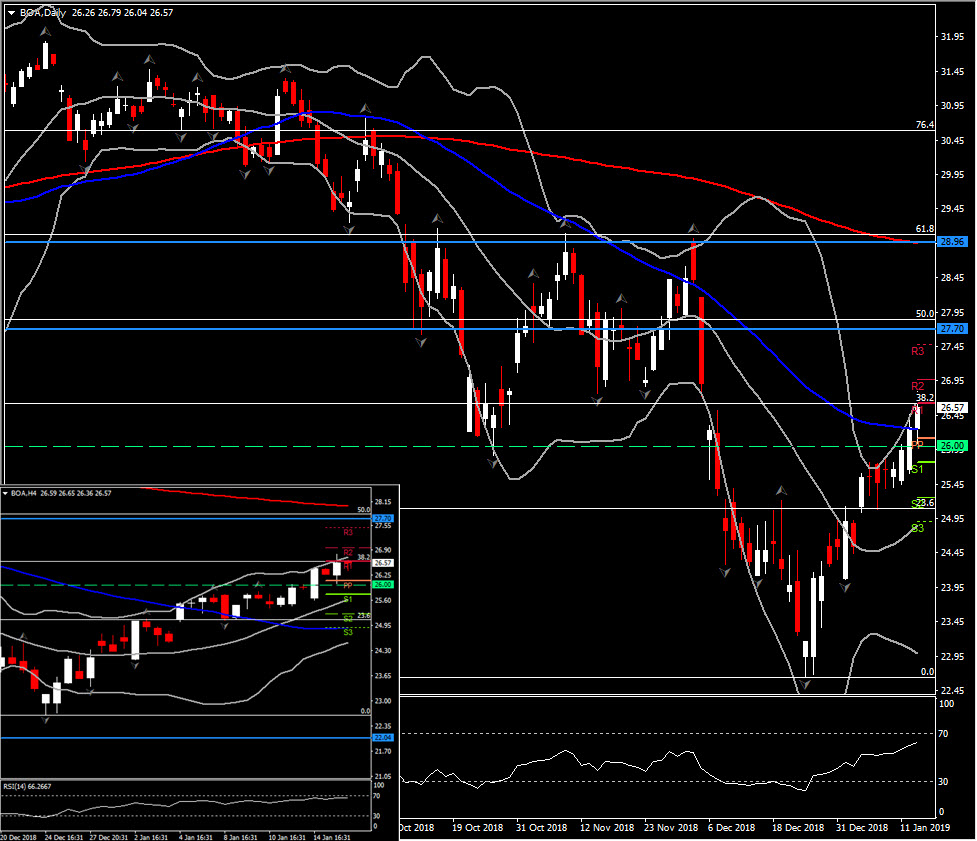
BOA, H4 and Daily
After a disappointing year with the Bank of America stock price suffering declines up to 32%, it started the year with very high hopes, following a rebound from 19-month low at 22.65 on December 24. The strong demand noticed since then helped the asset start 2019 in bullish mode.
Tha decisive turn, shifted BOA price above 26, breaking the 50-day SMA and reaching the 38.2% retracement level since 2018 peak. The asset touched the upper Bollinger Bands pattern for a 7th day, while the upper Bollinger Bands pattern turned from flat and tight to expanded by extending its line northwards, suggesting further upside momentum.
Turning to momentum indicators, the daily outlook for the bank’s shares looks to be shifting to bullish, with trading activity taking place above 20- and 50-day moving averages. RSI is sloping north above its neutral zone, while MACD oscillator is strengthening its movement above the trigger line but below zero, supporting the decreasing bearish bias in the daily basis. Stochastics on the other hand flattened within the overbought area, giving the impression of a possible pullback or consolidation intraday/ near term.
As the asset has managed to break yesterday’s high, the next level to be watched is the 50% Fibonacci retracement level, after a confirmed closing above R2 at 27.00. A move above 50% Fib. hurdle could increase buying pressure and could shift attention to the area between the 200-day SMA and 61.8% Fib. level, at 28.96-29.00. This area provided strong Resistance for the asset between October and December. Support holds at 26.00. For intraday timeframes, Resistance stands at 27.70 and Support at 26.15.
Contrarily, an extension lower for BOA price, could confirm the continuation of its 8-month decline, but only if we face losses below 24.85, which coincides with the 23.6% Fib. level and 20-day SMA.
Click here to access the HotForex Economic Calendar
Andria Pichidi
Market Analyst
HotForex
Disclaimer: This material is provided as a general marketing communication for information purposes only and does not constitute an independent investment research. Nothing in this communication contains, or should be considered as containing, an investment advice or an investment recommendation or a solicitation for the purpose of buying or selling of any financial instrument. All information provided is gathered from reputable sources and any information containing an indication of past performance is not a guarantee or reliable indicator of future performance. Users acknowledge that any investment in FX and CFDs products is characterized by a certain degree of uncertainty and that any investment of this nature involves a high level of risk for which the users are solely responsible and liable. We assume no liability for any loss arising from any investment made based on the information provided in this communication. This communication must not be reproduced or further distributed without our prior written permission.