Elon Musk, CEO of the electric vehicle behemoth Tesla, has recently been reported of possible headcount trimming by 10%, following uncertainty over economic outlook. That would account for an approximate 10,0000 employees to be laid off.
Earlier, there was news that Musk stated in his email “to pause all hiring worldwide”. He has also demanded employees “to return to office or leave”, in the midst of resurgence of Covid-19 in California, in which one of its most advanced automotive plants is located. The threat of virus has been significantly reduced, however, it is also an undeniable fact that return-to-office resistance is real.
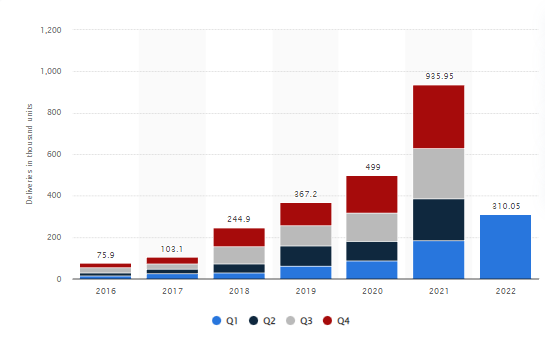
Fig. 1: Number of Tesla Vehicles Delivered Worldwide. Source: Statista.
The company has delivered more than 300,000 units of vehicles during Q1 2022, up 68% from the same period last year. Despite the increasing R&D cost incurred, total revenue of the company stood at $18.7B, up 81% from the same period a year ago. About 90% of the revenue contributed by vehicle sales, whereas the rest 10% contributed by energy-related services and insurance services. The latter saw an increase in revenue by 24.7% and 43.23% respectively from prior year ago. EPS were reported at $3.22, over market consensus by more than 40%.
Be it a major staff cut, or voluntary resignation due to displeasure over Musk’s return to office plan, coupled with ongoing supply chain issues, increasing competition and rising costs following inflationary pressures – these factors would serve as headwinds to Tesla’s development in near term. Could Tesla produce over 1.5 million vehicles by the end of this year? That remains a question.
Technical Analysis:
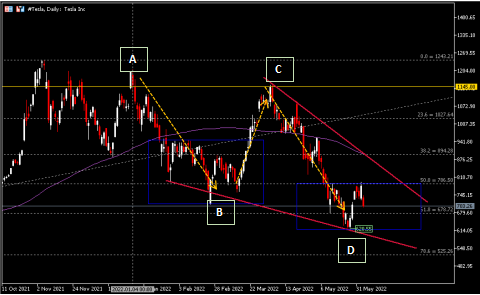
Throughout the first half of 2022, #Tesla share price was traded in a downtrend, in the form of ABCD structure. The company share price saw its highest point in the beginning of January, at $1207.88 (point A), before retracing to a lower point at $710 (point B) in late February. Its share price found support and rebounded, forming a lower high at $1152.64 (point C), before retracing again and formed a lower low at $620.55 (point D). In near term, the company share price remains directionless as it consolidated between $786.50 (FR 50.0% extended from lower leg seen in September 2020 to the highest point seen in November 2021), the minor support $678.72 (FR 61.8%) and the lowest point seen on 24th May, $620.55. To trade higher, the asset price must break above $786.50 and the upper line of descending wedge, towards the next resistance target at $894 (or the 100-day SMA) and $1028. Otherwise, a strong bearish candlestick close below the minor support, $620.55 and the lower line of descending wedge may indicate bearish possibility for the price to test the next support at $525 (FR 78.6%), $450 and $330.
Click here to access our Economic Calendar
Larince Zhang
Market Analyst – HF Educational Office – Malaysia
Disclaimer: This material is provided as a general marketing communication for information purposes only and does not constitute an independent investment research. Nothing in this communication contains, or should be considered as containing, an investment advice or an investment recommendation or a solicitation for the purpose of buying or selling of any financial instrument. All information provided is gathered from reputable sources and any information containing an indication of past performance is not a guarantee or reliable indicator of future performance. Users acknowledge that any investment in Leveraged Products is characterized by a certain degree of uncertainty and that any investment of this nature involves a high level of risk for which the users are solely responsible and liable. We assume no liability for any loss arising from any investment made based on the information provided in this communication. This communication must not be reproduced or further distributed without our prior written permission.