BTCUSD
As stated in early November’s post: “The similar performance of US stocks and Bitcoin is quite rare within 2018, and more precisely in the 2nd half of the year. In October, US stocks faced the biggest drop seen in the past 7 years, in contrast with Bitcoin which faced remarkably low volatility.
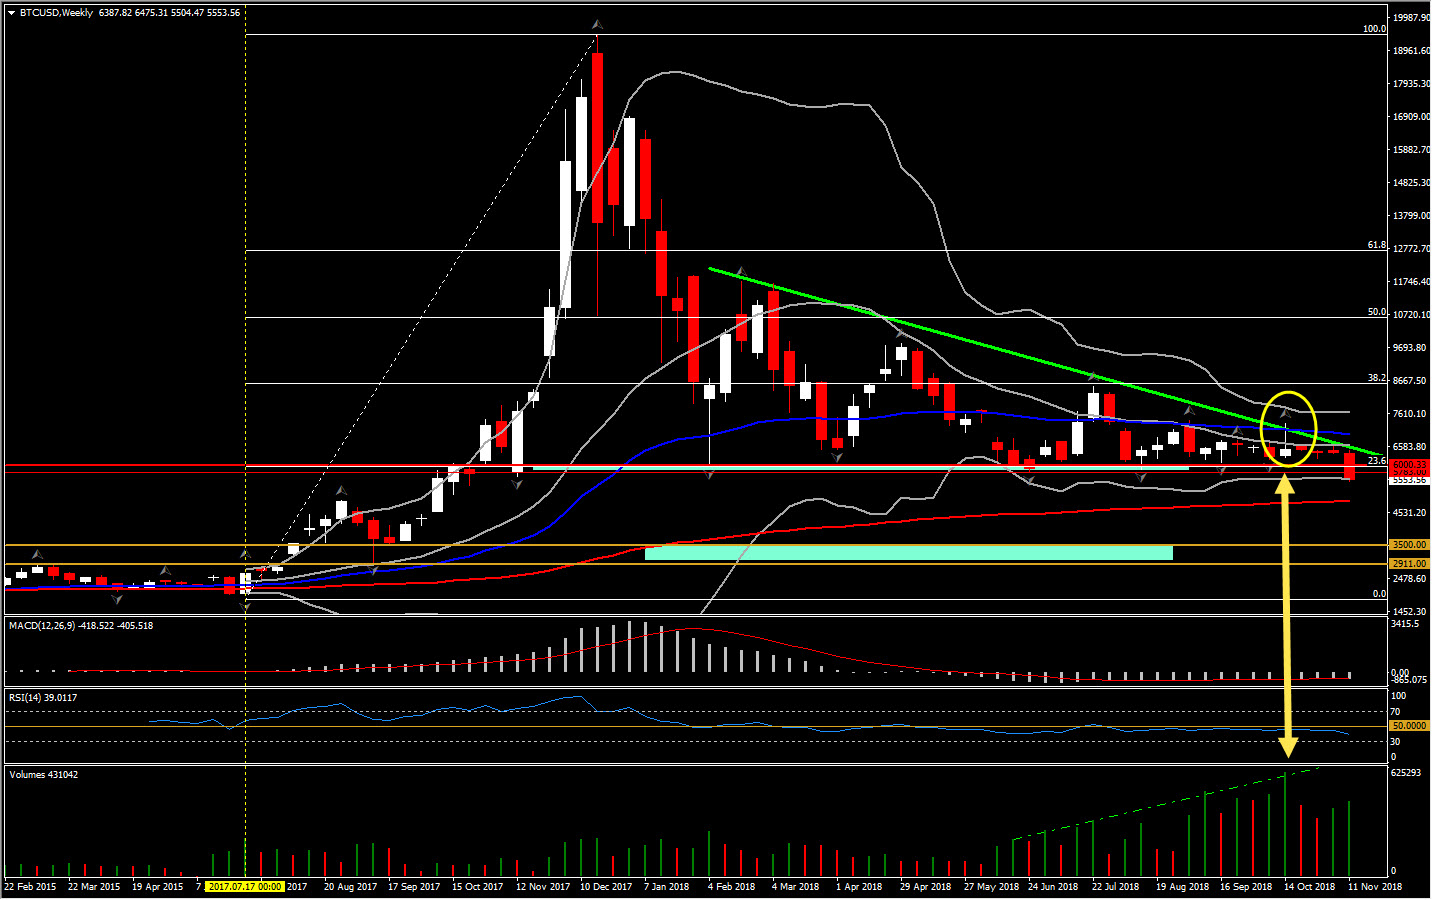
The volume had been rising since June 2018 as price has been falling. This indicates that sellers require decreasing numbers and increasing enthusiasm in order to keep pushing prices lower. Theoretically, a price drop on large volume is a stronger signal that something in the stock has fundamentally changed. Hence this could suggest that the price might fall further.”
This had been confirmed , as the asset remains to the downside, while significant is the fact that it finally entered today a strong Support area, as stated on the August 14 post – “Hence only the breakout of triangle’s trendline and 6-months Support level at $5,783 (also 150-day SMA), could open the doors to the downside, with next Support at $3,500-$2,911.00 ( at 150-day SMA and October 2017 low).”
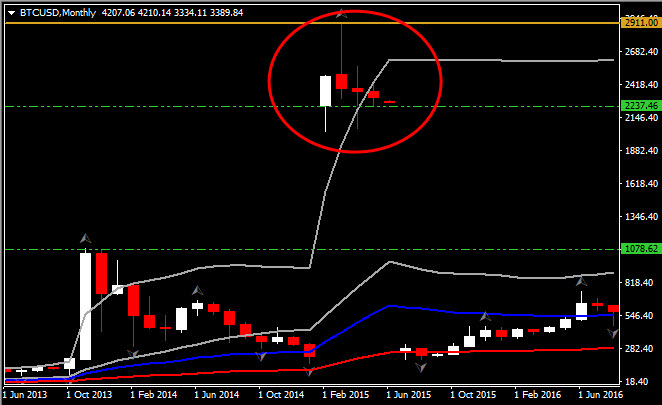
Despite the sharp sell-off the past 3 weeks, the asset is looking to close the week with the same negative sentiment. From the technical perspective, there is no sign of positive momentum in the market, as the asset is trading outside the weekly Bollinger Bands while they keep extending to the downside. Meanwhile, daily and weekly momentum indicators configured negatively within the oversold area, without looking that bottom has been reached yet. The Support remains at $2,911.00 (October 2017 low), while on the break of this, next level to watch is at $2,200-$2,237 area. The latter reflects to FE200 but importantly the temporary spike seen in the 1st Quarter of 2015 as illustrated in the figure below.
Click here to access the HotForex Economic calendar
Andria Pichidi
Market Analyst
HotForex
Disclaimer: This material is provided as a general marketing communication for information purposes only and does not constitute an independent investment research. Nothing in this communication contains, or should be considered as containing, an investment advice or an investment recommendation or a solicitation for the purpose of buying or selling of any financial instrument. All information provided is gathered from reputable sources and any information containing an indication of past performance is not a guarantee or reliable indicator of future performance. Users acknowledge that any investment in FX and CFDs products is characterized by a certain degree of uncertainty and that any investment of this nature involves a high level of risk for which the users are solely responsible and liable. We assume no liability for any loss arising from any investment made based on the information provided in this communication. This communication must not be reproduced or further distributed without our prior written permission.