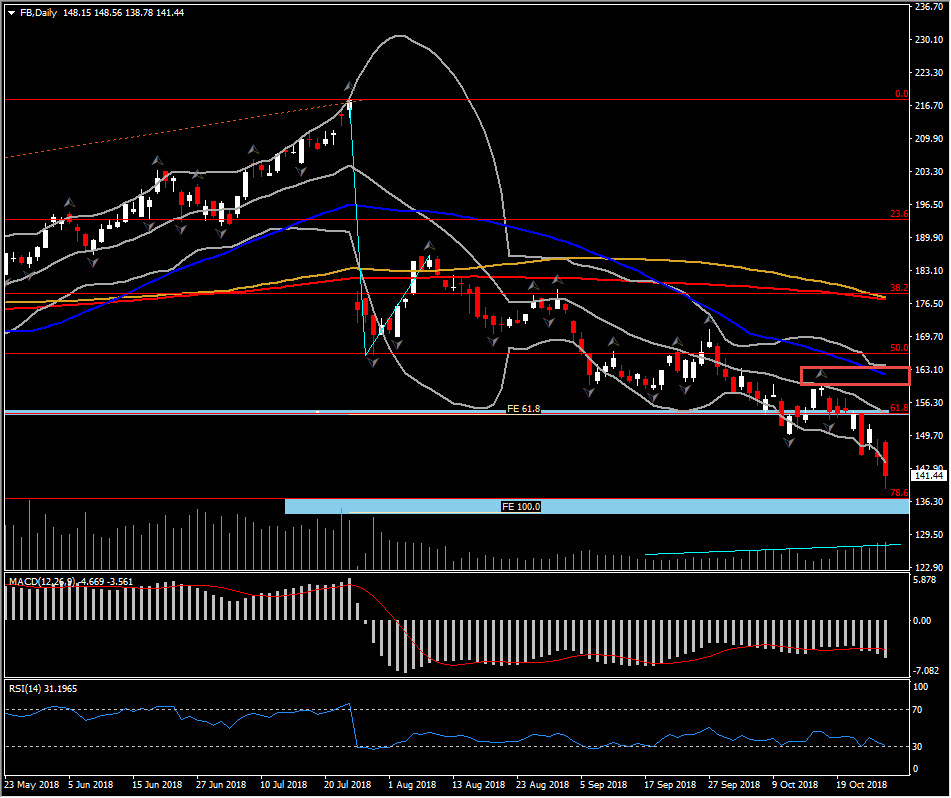
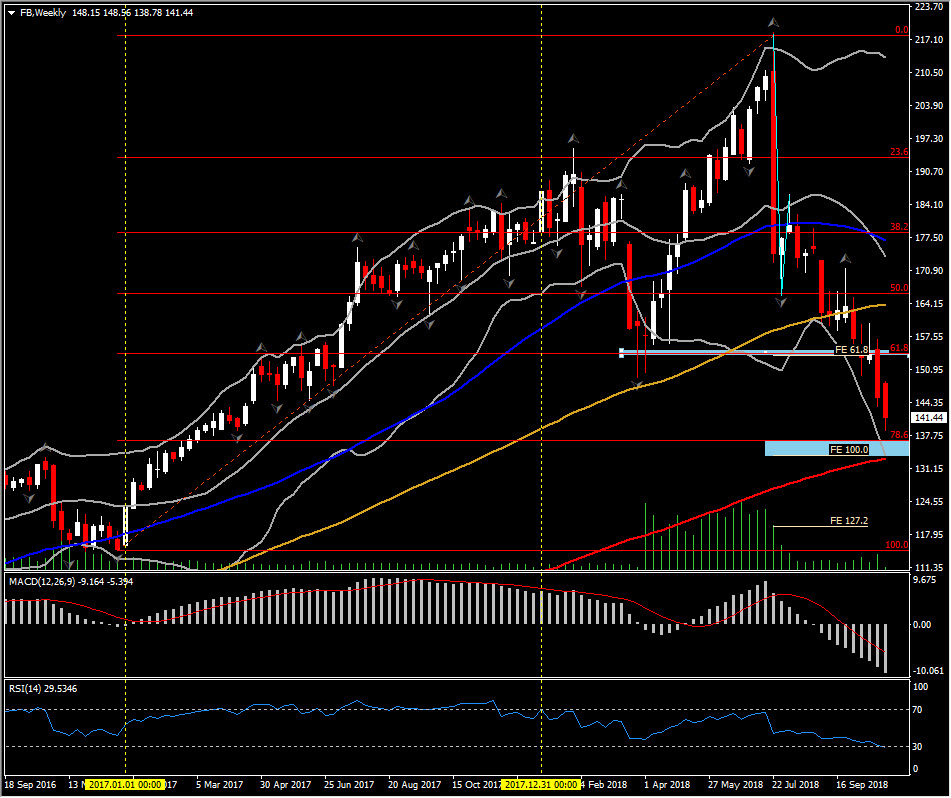
FB , Daily and Weekly
This will be a busy and important week in the US for data and earnings, but today’s slate is rather quiet with just CB Consumer Confidence. Earnings include Facebook, Ebay, T-mobile, Morgan Stanley, Coca-Cola, GE etc. Hence as we are in the midst of Earning Season, the focus turns today to another tech giant after Amazon and Alphabet – Facebook and its third Quarter earnings release for 2018 after today’s closing bell on Wall Street.
Facebook’s consensus recommendation is “strong buy”, corresponding to the majority of the consensus recommendation for the Online Services peer group , as 24 out of 31 Analyst Firms recommend “Strong buy” and 3 propose the “buy” possibility, while 4 suggest remaining on hold. According to Zacks Investment Research, the social network giant is expected to have $1.47 in earnings per share during the third Quarter of 2018, which represents a decline by nearly 7% since the reported EPS for the fiscal Quarter ending September 2017. Revenue is expected to be released at $13.78 billion, 34% up from the $3.91 billion reported the previous quarter.
Aside from the EPS number, investors would probably turn their eyes exclusively to revenue and user growth outcome, as the miss on revenue and user growth the last quarter drove Facebook’s stock price down by 33%. At this stage, we have to point out that since September 2017, the company’s revenue missed expectations only once, while earnings per share always positively surprised. Despite the robust earning reports, Facebook stock price was seen sharply decreasing after the release of the earnings report the last Quarter, due to the miss of revenue, the slowdown on users growth and the huge spending on security and account fraud. The stock drifted from its $218.48 high in June 2018, to $138.78 as of today, which represents more than $200 billion in market value.
The 3 months after July 22 were dramatic for Facebook, as the company had to face regulation threats, the breach of privacy for its users, the hack of millions of accounts, the suspension of misinformation, executive departures and claims from their advertisers for manipulation of video metrics. All these barriers added further pressure on stock price and caused the dramatic decline since then. Meanwhile it seems that Facebook has not managed to overcome all these problems, since new misinformation news have been announced just last Friday. Facebook is currently fighting to eliminate misinformation ahead of the US mid-term elections.
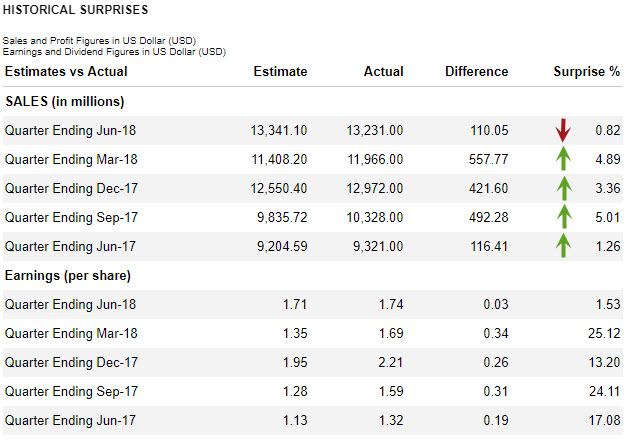
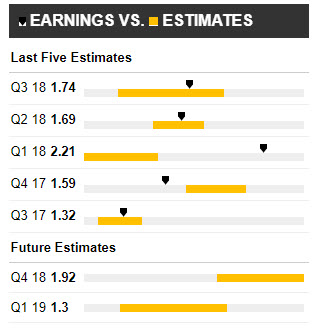
Figure 2: [Thomson Reuters. (2018)] Reprinted from Facebook Inc. Financial Highlights, retrieved from https://www.reuters.com/markets/stocks .
As privacy was one of the main aids for Facebook’s underperformance, the decline in the global Equity market also weighed on stock price – USA30 is down by 7.62% QTD and USA500 declined by 9.36% QTD. Facebook is a part of both the USA500 and USA30 indices. The nagging trade/tariff concerns appeared to be vindicated by earnings shortfalls first in the semiconductor sector, then tech more broadly as follow-up misses by momentum titans Amazon and Alphabet took a bite out of the FAANGS.
Therefore along with the earnings report today, focus will be also on the conference that follows the release, regarding any remarks on the company’s growth and privacy problems.
Turning to the technical side, if the company achieves accuracy with its forecast, then a positive earnings outcome without any negative surprises on revenue and users growth could attract some bulls back into the market. This could boost price action higher and hence a correction to 4-month drop could be seen. In the short term, a decisive turn to the upside could find Resistance at $154.00-$155.00 area, which reflects the confluence of 20-day SMA, but importantly the confluence of 61.8% Fib level on 2-year rally and the 61.8% Fib. extension on the massive decline which occurred on July. Further potential Resistance could come near $166.00, the 50.0% Fib. level.
In the long term, after the 33% drop since July, only a spike above $176.90 could turn the outlook from bearish to a bullish one again. This strong Resistance level holds at the 50-week SMA and it is also the mid point of July to up-to-date performance. Hence if the asset manages to hold above this level, it could retest the year high at $218.49.
For now, the sell-off sentiment continues to push stock price lower, amid a combination of events. Therefore a disappointing earnings outcome could extend Facebook’s price lower. The next Support could be found at the $133.20 – $136.68 area, which includes the 200-week SMA, the 78.6% Fib. level and the 100.0% Fib. extension.
A break of this area and more precisely the $133.20 barrier is crucial as it is a “free fall” from that level downwards. This level is set at the 200-week SMA which coincides with the lower Bollinger Bands pattern. Support after this area could possibly occur around December 2016 prices, around the $114.00 level.
Technically, the weekly-term outlook for the corporation’s shares remains bearish, with trading activity taking place below 50 and 100- week moving averages, while momentum indicators comply with this as well. RSI is at 29 and falling, suggesting that there is further space to the downside. MACD lines crossed below neutral zone and signal line, while they are increasing to the downside, suggesting the potential rise of negative momentum. However as long as the floor at $133.20 – $136.68 holds, then there are still hopes for an upwards correction in the short term.
Click here to access the HotForex Economic calendar.
Want to learn to trade and analyse the markets? Join our webinars and get analysis and trading ideas combined with better understanding on how markets work. Click HERE to register for FREE! The next webinar will start in:
[ujicountdown id=”Next Webinar” expire=”2018/10/31 13:00″ hide=”true” url=”” subscr=”” recurring=”” rectype=”second” repeats=””]
Andria Pichidi
Market Analyst
HotForex
Disclaimer: This material is provided as a general marketing communication for information purposes only and does not constitute an independent investment research. Nothing in this communication contains, or should be considered as containing, an investment advice or an investment recommendation or a solicitation for the purpose of buying or selling of any financial instrument. All information provided is gathered from reputable sources and any information containing an indication of past performance is not a guarantee or reliable indicator of future performance. Users acknowledge that any investment in FX and CFDs products is characterized by a certain degree of uncertainty and that any investment of this nature involves a high level of risk for which the users are solely responsible and liable. We assume no liability for any loss arising from any investment made based on the information provided in this communication. This communication must not be reproduced or further distributed without our prior written permission.