BTCUSD, D1
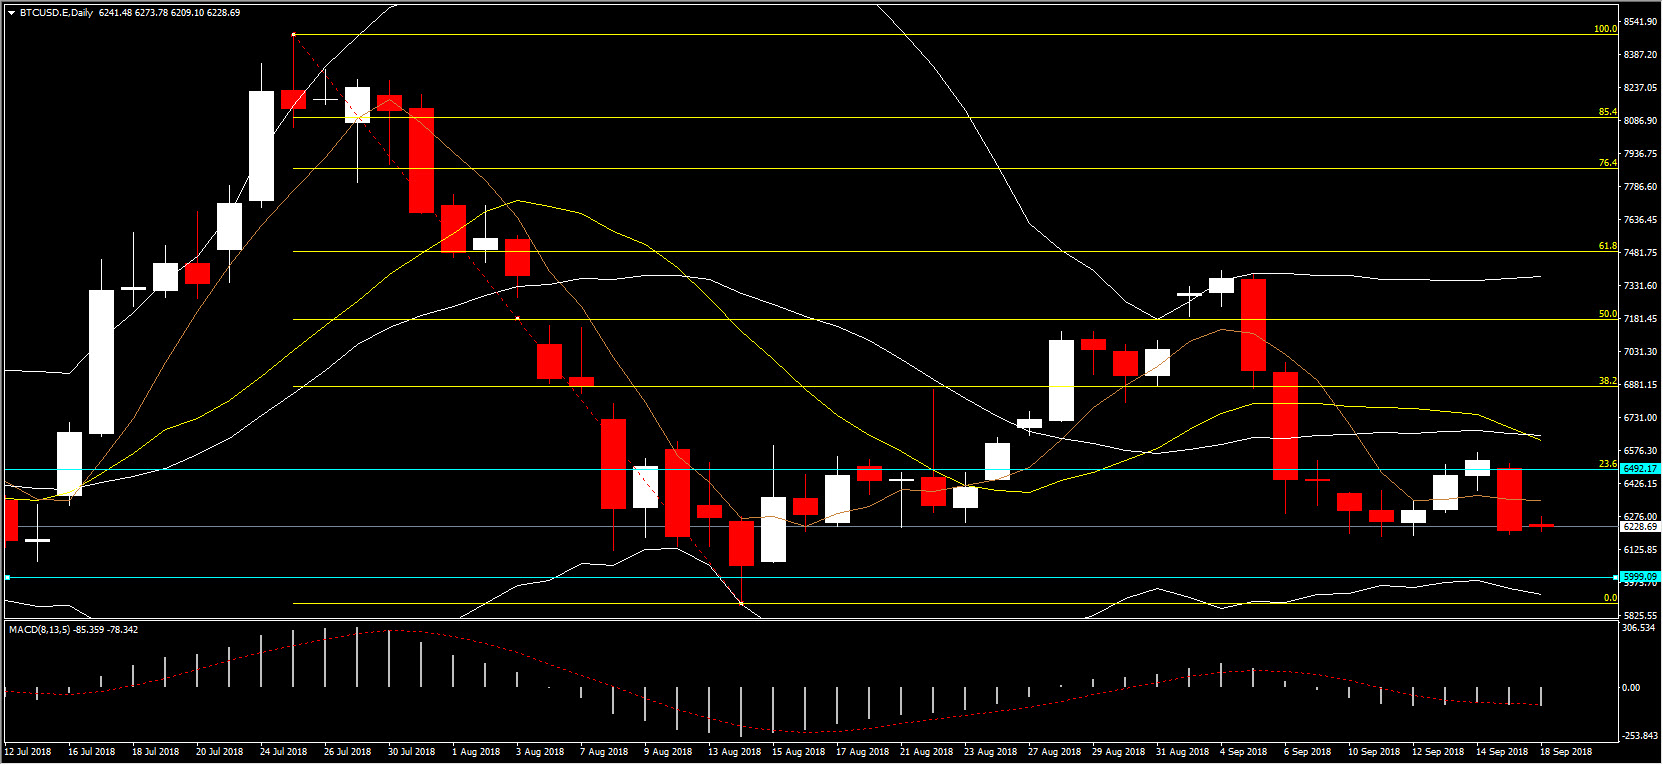
Ever since its December 2017 peak, Bitcoin has been following a downwards trend which appears to have, nonetheless, remained above the peak-to-trough (July 2017-December 2017) 23.6% Fibonacci level at 6008, albeit slowly converging towards it. Indicators are sending off signals of calmness, with RSI remaining withing the 30-70 bound since January, with only minor instances of escaping. Volume indicators are also not providing meaningful patterns, despite their increase since the start of September, and neither is the ATR, which appears to be relatively stable.
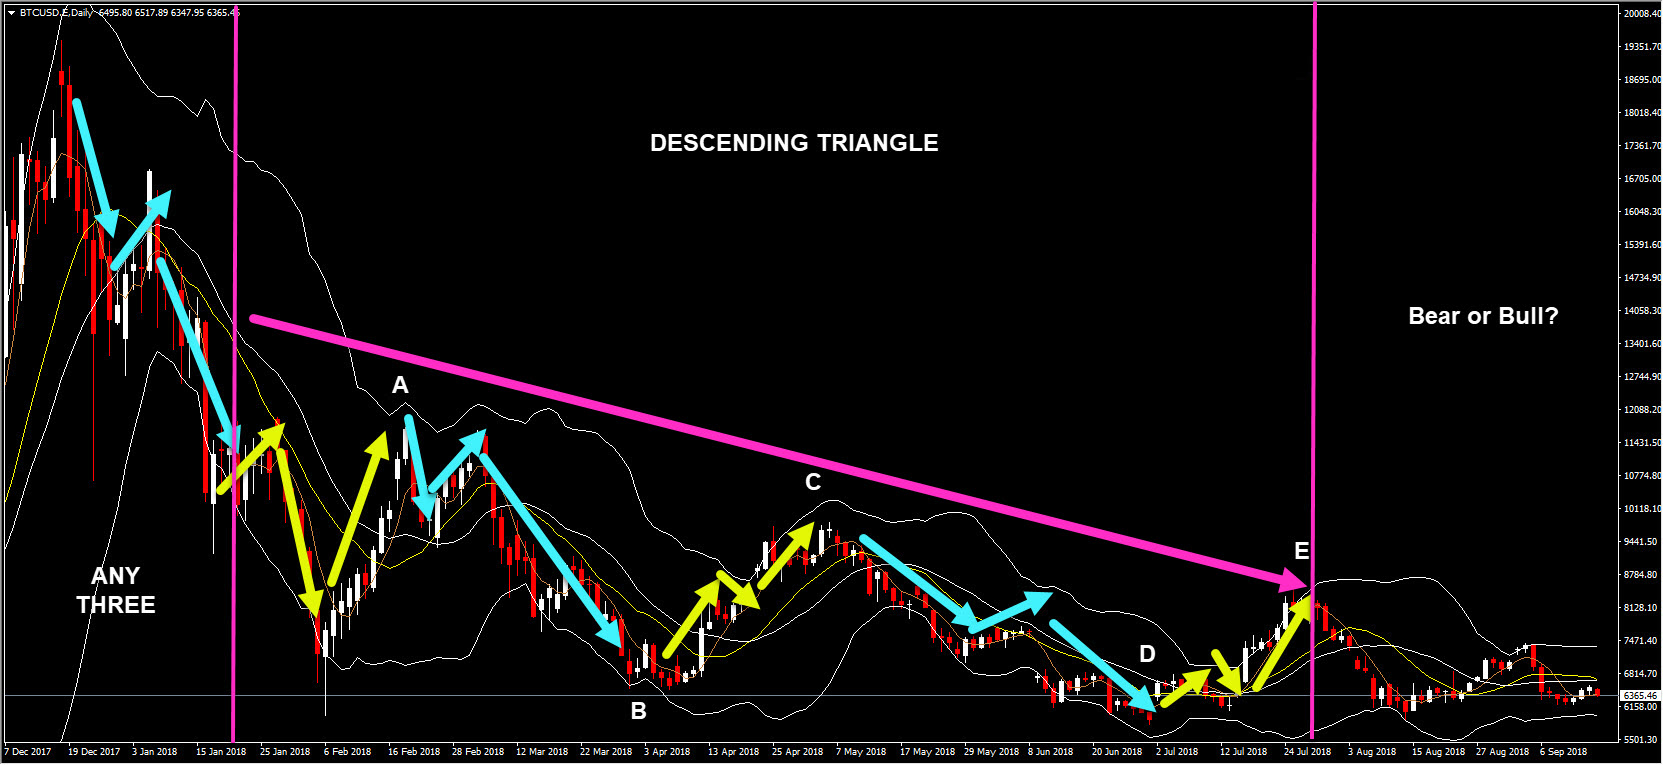
An Elliott Wave analysis does not provide much more information either: the peak in December was followed by a three-movement Wave, and a descending triangle formation. The end of the triangle could either suggest a bear market or another three-movement Wave which could lead to the bull area. At this current juncture, we are still unable to tell.
Gold appears to have a statistically negative relationship with Bitcoin price, suggesting a potential substitution effect between the two instruments, at least for the sample ranging from July 2017 to present. Further to this, Gold appears to have the expected negative relationship with the USDIndex, suggesting that a Dollar appreciation lowers the value of Gold. Interestingly, Bitcoin does not appear to have any statistical relationship with the USDIndex, given that its value does not rely on macroeconomic developments.
Where does that leave us then? At this juncture, the USDIndex appears to be on a downwards trend, while the price of Gold appears to have stabilised. This stabilisation is also evident in the Bitcoin price, which has been fluctuating between the 0% and 23.6% Fib. levels since the beginning of September. The band is quite large, ranging from 5880 to 6492, with no closing price below the USD6000 psychological barrier in the past year, other than a trough in June which was followed by an immediate reaction. Consequently, the big question is whether Bitcoin will break below this barrier, with 5- and 14-day moving averages pointing to that direction. Still, it could be the case that this trend may reverse if other news comes to light.
Click here to access the HotForex Economic calendar.
Want to learn to trade and analyse the markets? Join our webinars and get analysis and trading ideas combined with better understanding on how markets work. Click HERE to register for FREE! The next webinar will start in:
[ujicountdown id=”Next Webinar” expire=”2018/09/18 14:00″ hide=”true” url=”” subscr=”” recurring=”” rectype=”second” repeats=””]
Dr Nektarios Michail
Market Analyst
HotForex
Disclaimer: This material is provided as a general marketing communication for information purposes only and does not constitute an independent investment research. Nothing in this communication contains, or should be considered as containing, an investment advice or an investment recommendation or a solicitation for the purpose of buying or selling of any financial instrument. All information provided is gathered from reputable sources and any information containing an indication of past performance is not a guarantee or reliable indicator of future performance. Users acknowledge that any investment in FX and CFDs products is characterized by a certain degree of uncertainty and that any investment of this nature involves a high level of risk for which the users are solely responsible and liable. We assume no liability for any loss arising from any investment made based on the information provided in this communication. This communication must not be reproduced or further distributed without our prior written permission.