


AUDCAD, EURCAD and CADJPY
As I wrote on Wednesday: “Therefore a breakout below Support area along with the fact that the pair moves within the lower Bollinger Band area for the 4th day in a row, would suggest the retest of the next Support area at 1.2985-1.3015. The latest Support area is set between 61.8% Fib. level and the 61.8 Fibonacci extension from the rebound seen on July 9. Further losses would open the doors towards 1.2900, and the confluence of 200-day SMA and the FE 127.2, at 1.2820. Another sign for the bearish outlook of the USDCAD could be the confirmation of the head and shoulders formation in the medium term chart. A closing today below pattern’s trendline at 1.3060 will confirm the particular bearish candlesticks formation. ”
Indeed the pair broke Support at 1.3060, while the general strength in the Dollar yesterday boosted USDCAD, though gains were trimmed late in the day. The USDCAD is currently consolidating around the 50% Fib. level at 1.3060, however the confirmation of the head and shoulders formations along with the negative momentum indicators, the breakout of upside trendline since April and the fact that the pair is moving below 20 and 50-day SMA, continue to strongly support the bearish scenario for the pair.
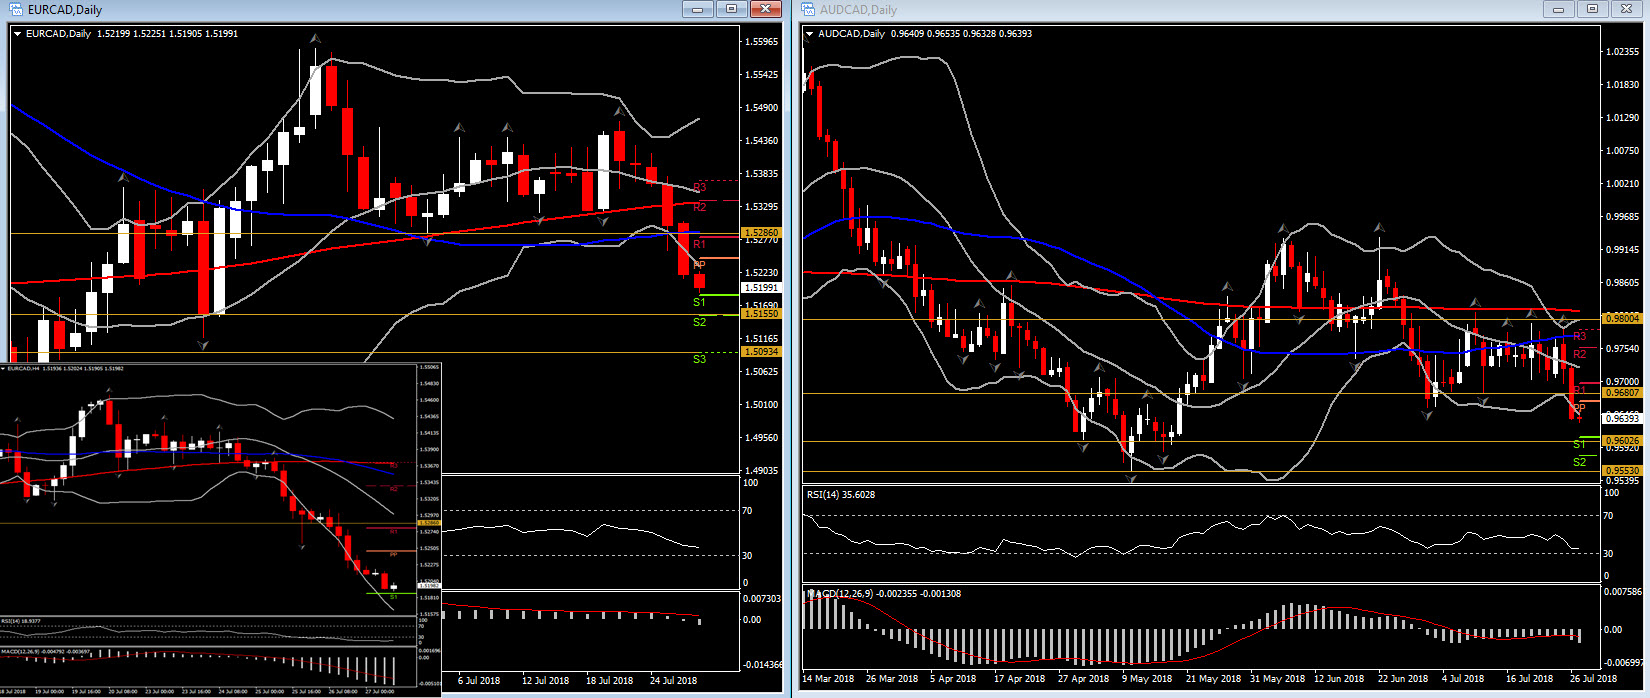
Meanwhile, the same picture could be identified against most majors but more precisely against the commodity currencies such as Kiwi and Aussie. AUDCAD formed a full body daily candle yesterday, closing outside Bollinger Bands after breaking July’s Support at 0.9680. Hence as momentum indicators have not reached oversold area yet and with the price action moving below PP level today without any sufficient move to the upside, the negative momentum is likely to strengthen. Next Support levels are at the round 0.9600 and May’s bottom at 0.9553.
Additionally, based on the sharp sell-off since last Friday, EURCAD is also moving towards oversold levels, something that could be seen as a possibility of a bullish correction to the upside in short term.
EURCAD is currently trading a breath above S1 at 1.5186, after 6 consecutive negative days,with the next Support levels set at 1.5155 and 1.5093. A breakout of S1 is likely to lead to a retest of S2 and S3. However as in the 4-hour chart, momentum indicators present an oversold picture, a rebound above S1 and a break above day’s peak at 1.5220, suggesting a swing higher towards PP level at 1.5245-50.
CADJPY on the other hand, has been sloping to the upside since the July 24 rebound. In the 1-hour chart, it is well supported by 50-period MA, while it is currently trading above the 50% fib. level at the round 85.00 level.
Momentum indicators in the hourly chart though are supporting that positive intraday momentum as RSI just crossed above 50. MACD is giving some mixed signals as it remained in the positive area but it flattened with its trigger line suggesting consolidation in short term. Next Resistance level for CADJPY is set at 85.16-85.20 area. A closing above 85.20 implies the increase of the positive momentum up to July’s high at 85.75.
To the downside, a failure to break the last hourly swing high at 85.10 would suggest a drift to 50-period MA at 84.90. If price moves lower, the next support area are: 84.80 ( yesterday’s bottom) and 84.60 (23.6% since decline on July 18.
Click here to access the HotForex Economic calendar.
Want to learn to trade and analyse the markets? Join our webinars and get analysis and trading ideas combined with better understanding on how markets work. Click HERE to register for FREE! The next webinar will start in:
[ujicountdown id=”Next Webinar” expire=”2018/07/31 14:00″ hide=”true” url=”” subscr=”” recurring=”” rectype=”second” repeats=””]
Andria Pichidi
Market Analyst
HotForex
Disclaimer: This material is provided as a general marketing communication for information purposes only and does not constitute an independent investment research. Nothing in this communication contains, or should be considered as containing, an investment advice or an investment recommendation or a solicitation for the purpose of buying or selling of any financial instrument. All information provided is gathered from reputable sources and any information containing an indication of past performance is not a guarantee or reliable indicator of future performance. Users acknowledge that any investment in FX and CFDs products is characterized by a certain degree of uncertainty and that any investment of this nature involves a high level of risk for which the users are solely responsible and liable. We assume no liability for any loss arising from any investment made based on the information provided in this communication. This communication must not be reproduced or further distributed without our prior written permission.


