


USA500, Daily and Intraday
Trade jitters have calmed somewhat and investors are focusing on the start of the earnings season, with Stock market sentiment remaining upbeat in Asia. UK Futures moved higher with US Futures overnight, underpinned by a weaker Pound. The Stoxx Europe 600 Index is moving higher and is also poised for weekly gains, with techs, automakers and miners leading the way. Trumps’ thrashing of May’s Brexit plans and his praise for her adversary Johnson has been weighing on the Pound and at least so far this seems to be underpinning the UK100 which is up 0.56% in early trade, outperforming other European markets.
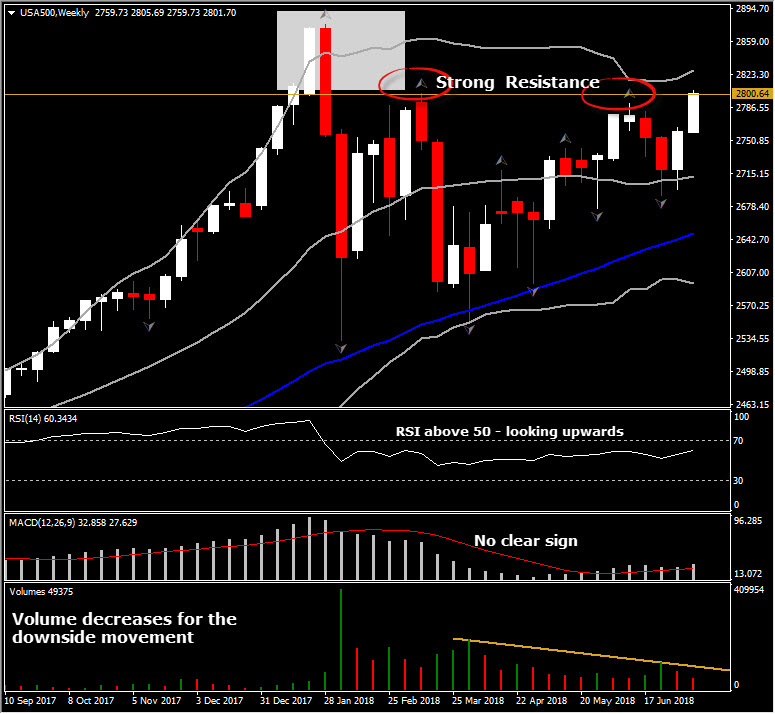
In the US, Equities have retained gains with the USA500 at 2,800.65. USA500 has been trading in a longterm upchannel since April and the latest correction to the downside occurred within June. In July it is showing modest gains, which boosted USA500 since yesterday within 2,791.00- 2,807.00 area. This particular area was rejected several times the last 5 months, that made it an extremely strong Resistance. More precisely it is consistent with 2 consecutive weekly upper fractals along with 5-month highs of price action and it is set between June’s peak and the 1st level of Fibonacci extension. Fibonacci extension was set after the retracement swing low occurred on June 28.
Momentum indicators suggest that outlook is turning positive again, as daily RSI rebounded above 59 swing low and MACD turned positive with its lines increasing above its signal line. Stochastic however is moving within the overbought territory, suggesting that upside movement is running out of steam and therefore price could make a correction lower.
The overall picture of the USA 500 suggests that if the asset holds the strong rally and closes above 2,807.00, then bulls will likely to retest the next strong Resistance level at 2,837.00 (FE 127.2).
If however the rally fails to extend gains above 2,807.00, then this would imply that it has been brought to an end. A swing lower below June’s peak at 2,790.00, could trigger attention towards the confluence of 50-Day SMA and 50% Fib. level, at 2,740.00
Click here to access the HotForex Economic calendar.
Want to learn to trade and analyse the markets? Join our webinars and get analysis and trading ideas combined with better understanding on how markets work. Click HERE to register for FREE! The next webinar will start in:
[ujicountdown id=”Next Webinar” expire=”2018/07/17 14:00″ hide=”true” url=”” subscr=”” recurring=”” rectype=”second” repeats=””]
Andria Pichidi
Market Analyst
HotForex
Disclaimer: This material is provided as a general marketing communication for information purposes only and does not constitute an independent investment research. Nothing in this communication contains, or should be considered as containing, an investment advice or an investment recommendation or a solicitation for the purpose of buying or selling of any financial instrument. All information provided is gathered from reputable sources and any information containing an indication of past performance is not a guarantee or reliable indicator of future performance. Users acknowledge that any investment in FX and CFDs products is characterized by a certain degree of uncertainty and that any investment of this nature involves a high level of risk for which the users are solely responsible and liable. We assume no liability for any loss arising from any investment made based on the information provided in this communication. This communication must not be reproduced or further distributed without our prior written permission.


