The Walt Disney Company (#Disney) will announce its full-year and 2021 fourth quarter financial results on 10 November after market close. Disney is a diversified international home entertainment and media company with a market value of approximately $319 billion which operates in three main areas:
- media networks,
- amusement parks, experiences and products, studio entertainment, and
- Direct to Consumer and International (DTCI).
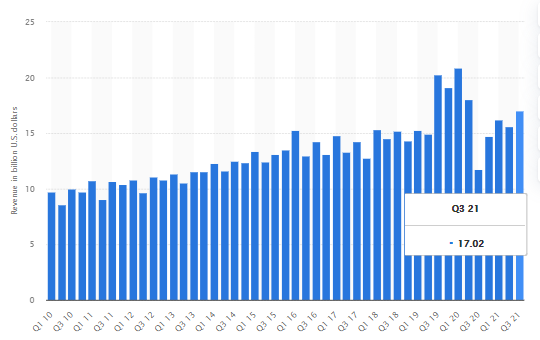
Figure 1: The Walt Disney Company’s revenue (US $billion) from 2010 to 2021
In the last quarter, Disney reported revenue of $17.02 billion, a year-on-year increase of more than 44%. The company recorded the highest revenue before the pandemic in the first quarter of 2020, reaching $20.88 billion. This was the second time the company has reached a benchmark of $20 billion since the third quarter of 2019 ($20.26 billion).
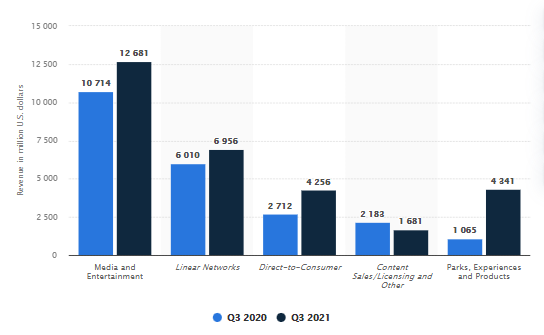
Its media and entertainment sectors contributed the most to the Walt Disney Company’s revenue of $126.81 billion (or 42.39%), followed by Disney’s linear network ($69.56 billion, or 23.25%), amusement parks, experience and products ($43 billion, or 14.51%), direct-to-consumer ($42.56 billion, or 14.23%) and, finally, in the capacity of sales/licensing and other ( $16.81 billion, or 5.62%). Except for content sales/licensing and others, the performance of all industries over the same period was better than last year. Among them, after the reopening of amusement parks, experiences and products in global theme parks (with the introduction of vaccines reducing restrictions), as well as the introduction of new tourist-centric services and experiences, the most significant three-fold revenue rebound has been achieved.
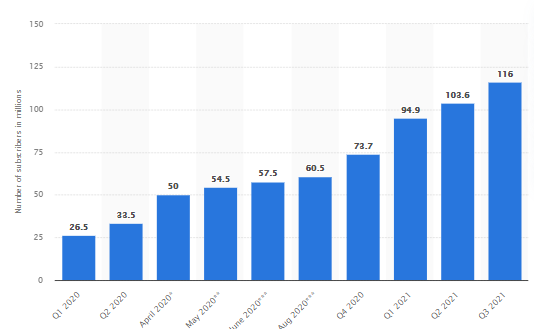
In the field of media and entertainment, the company provides a variety of Disney apps (with in-app purchases), among which Disney+ has the highest total revenue (others include ESPN, My Disney Experience, Marvel Unlimited, National Geographic, etc.). As shown in Figure 3, in the third quarter of 2021, the number of Disney+ global subscribers reached 116 million, which is more than three times that of the app in less than two years after its first launch in the first quarter of 2020, when only 26.5 million subscribers have been accumulated.
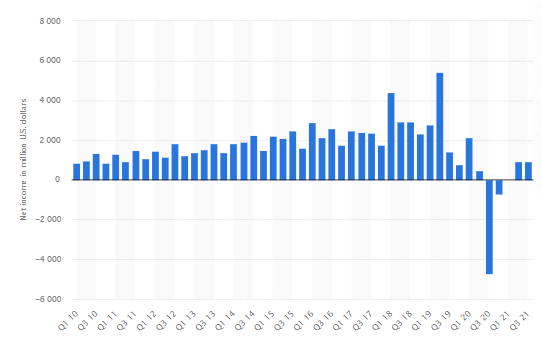
Figure 4: The Walt Disney Company’s net income (US $million), from the first quarter of 2010 to the third quarter of 2021.
Walt Disney’s net income in 2021 will remain positive. The company reported that its net profit in the second and third quarters exceeded $900 million, a year-on-year increase of 94.9% and 119.6%, respectively.
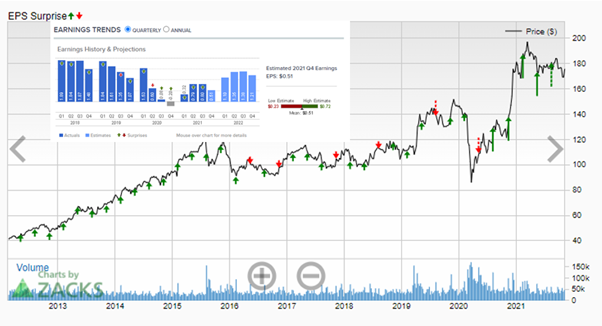
Figure 5: Earnings trends and earnings per share surprises. Source: CNBC; Zacks.
Zacks pointed out that in the upcoming earnings announcement, the general estimate of Walt Disney’s reported sales is $18.77 billion while earnings per share (EPS) are expected to reach $0.51, an increase of 27.6% and 355% over the same period last year. These estimates have been lowered twice in the past 30 days and 4 times in the past 60 days, showing signs of pessimism about the company’s business prospects. However, considering the positive surprises of 113.62% in the past four quarters, the results reported in the fourth quarter of 2021 may be better than generally expected. Overall, Walt Disney ranks #3 (hold) in the Zacks ranking.
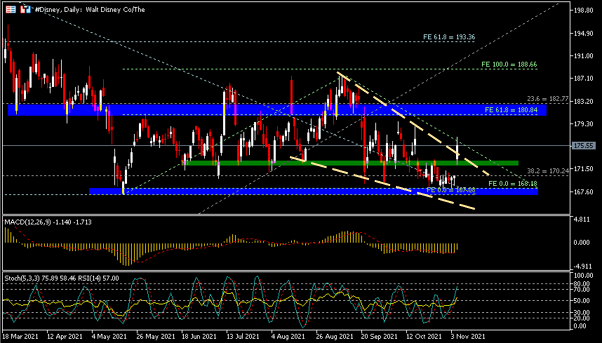
#Disney’s stock price closed $20 below the year’s high in the second half of 2021. The latest high was formed at $187.56 on September 9, which is about 8.2% lower than the peak of $203.02 in the first quarter.
Last Friday (November 5), the company’s stock price gapped and opened higher and closed above the top line of the falling wedge. The previous resistance level of $172-173 (green zone) has now turned to the immediate support level (S1), followed by $170 (S2) and $167-168 (S3). On the bright side, the nearest resistance level (R1) is $180-183. A successful candle close above this level could indicate that the stock will continue to test the bullish potential of the next resistance (R2), which includes the recent highs of $187.56 and $189. The third resistance level (R3) is located at $193. The indicators configuration is positive: the MACD line forms a golden cross and points upward to the 0 axis, RSI breaks through 50 for the first time since mid-May, and the stochastic indicator fast line is close to the overbought area.
Click here to view the economic calendar
Larince Zhang
Market Analyst
Disclaimer: This material is provided as a general marketing communication for information purposes only and does not constitute an independent investment research. Nothing in this communication contains, or should be considered as containing, an investment advice or an investment recommendation or a solicitation for the purpose of buying or selling of any financial instrument. All information provided is gathered from reputable sources and any information containing an indication of past performance is not a guarantee or reliable indicator of future performance. Users acknowledge that any investment in Leveraged Products is characterized by a certain degree of uncertainty and that any investment of this nature involves a high level of risk for which the users are solely responsible and liable. We assume no liability for any loss arising from any investment made based on the information provided in this communication. This communication must not be reproduced or further distributed without our prior written permission.