Regeneron Pharmaceuticals, Inc. (NASDAQ: REGN) is scheduled to report its Q4 and full 2020 fiscal year results this Friday, 5th February 2021 before the opening of the US market. Having been involved in the biotechnology industry for over 30 years, the company is well known for its ability to translate science into medicine and FDA-approved treatments in treating various kind of diseases.
In general, Regeneron Pharmaceuticals has been doing financially well in the latest three quarters, which topped the analysts’ consensus estimates.
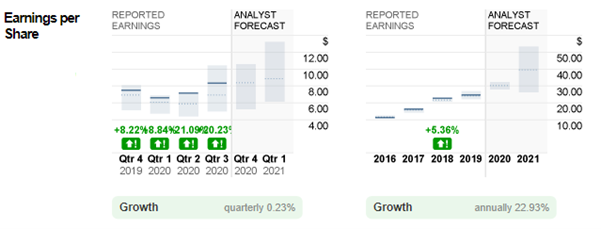
As seen from Figure 1 above, in 2020, the reported EPS for Q1, Q2 and Q3 was $6.60, $7.16, and $8.36. These figures outperformed analysts’ estimates by +8.84%, +21.09% and +20.23%. For the upcoming announcement, the company is expected to achieve $8.38/share, contributing to an estimated yearly EPS at $30.5, up 23.63% from 2019.
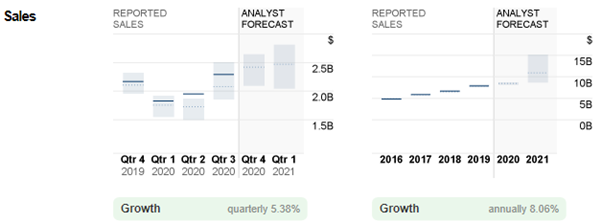
Figure 2 shows that Regeneron Pharmaceuticals reported sales of 1.8B in Q1 2020, in line with consensus estimates. Again, the company’s reported sales in Q2 and Q3 2020 exceeded analysts’ estimates by 17.64% and 9.52%, at 2.0B and 2.3B respectively. All in all, consensus estimates for 2020 sales stood at 8.5B, up 7.59% from 2019.
Considering the outstanding performance of the company, 17 out of 27 polled investment analysts have given a Buy rating to Regeneron Pharm stocks. A median estimate for the 12-month price target is set at $660.00, while ceiling and floor price stands at $793.00 and $550.00, respectively.
Last Thursday, a team of researchers and scientists confirmed the effectiveness of the company’s REGEN-COV antibody cocktail in neutralizing against variants of the Covid-19 virus including the UK and South Africa variants. Interim results revealed that 100% prevention of symptomatic infection can be achieved with passive vaccination, and approximately 50% lower overall rate of infection.
Technical Overview:
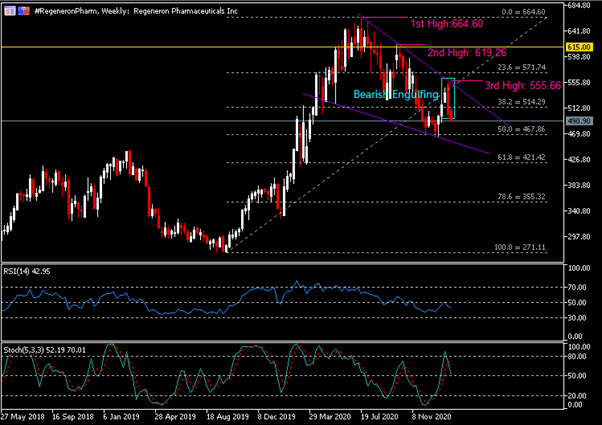
On the Weekly Chart, the #RegeneronPharm share price has been trending downward within the formation of a descending wedge pattern. The company’s share price left its first high in July last year, printed at $664.60. A second lower high ($619.26) was formed when the share price failed to break key resistance $615.00. Last week, the company’s share price pared its prior gains following a strong bearish momentum, thus leaving a third lower high at $555.66. A Bearish Engulfing candlestick pattern is seen at market close last week, in which price remained pressured below the 38.2 Fibonacci Retracement level, or $514.30. RSI is seen hovering below 50 while Stochastics has formed a bearish cross yet remains above 50.
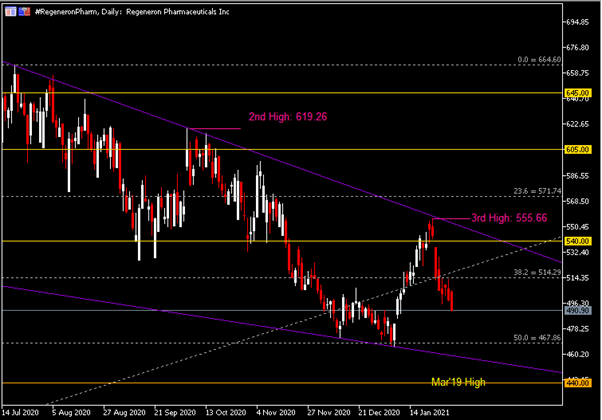
The Daily Chart shows that the company’s share price has experienced a long streak of losses over the past eight trading days, paring its short-term rebound by more than 50%. Key resistance levels to watch include the 38.2 Fibonacci Retracement level ($514.30), $540.00/upper trend line of descending wedge and $555.66. On the contrary, key support levels are the 50.0 Fibonacci Retracement level ($467.90), lower trend line of descending wedge and $440.00, the high level as printed in March 2019.
Click here to access the HotForex Economic Calendar
Larince Zhang
Market Analyst
Disclaimer: This material is provided as a general marketing communication for information purposes only and does not constitute an independent investment research. Nothing in this communication contains, or should be considered as containing, an investment advice or an investment recommendation or a solicitation for the purpose of buying or selling of any financial instrument. All information provided is gathered from reputable sources and any information containing an indication of past performance is not a guarantee or reliable indicator of future performance. Users acknowledge that any investment in Leveraged Products is characterized by a certain degree of uncertainty and that any investment of this nature involves a high level of risk for which the users are solely responsible and liable. We assume no liability for any loss arising from any investment made based on the information provided in this communication. This communication must not be reproduced or further distributed without our prior written permission.