


JPMorgan, the world’s largest bank by market capitalization (over $600B), shall deliver its earnings result for the fiscal quarter ending September 2024 on 11th October (Friday), before market open. The bank conglomerate offers a range of financial and investment banking services and products in all capital markets, including advising on corporate strategy and structure, capital raising in equity and debt markets, risk management, market making in cash securities and derivative instruments, brokerage and research.
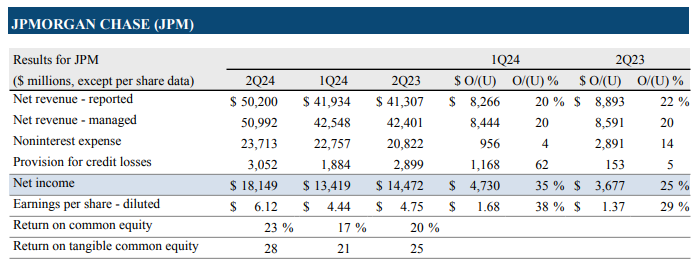
JPMorgan: Financial Measures. Source: Earnings Press Release
In Q2 2024, JPMorgan delivered $50.2B in net revenue, up 19.7% from the previous quarter, and up 21.5% from the same period last year. Net income was reported at $18.1B , up 35% from the previous quarter, and up 25% from Q22023.
By business segment, Commercial & Investment Bank contributed the most to the banks’ revenue ($17.9B, up 9% (y/y)); Consumer & Community Banking reported $17.7B in revenue, up slightly 3% from the same period last year; Corporate, on the other hand, brought in $10.1B in revenue, a leap of over 170% from the same period last year, driven by improvement in both net interest income and noninterest revenue. Last but not least, Asset & Wealth Management reported $5.2B in revenue, up 6% (y/y, following growth in management fees, strong net inflows and higher brokerage activity, then offset by deposit margin compression).
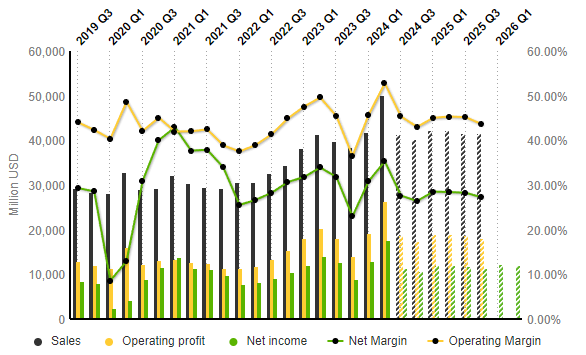
JPMorgan: Income Statement Evolution. Source: Market Screener
According to projection by S&P Global Market Intelligence, sales revenue for the coming quarter is expected to reach $41.4B, down -17.4% (q/q), but up 3.9% (y/y) respectively. Net income is projected to hit $11.5B, down -35.4% from the previous quarter, and down -9.7% from the same period last year. In addition, net margin is projected to decrease towards 27.62% (was 35.29% in the previous quarter).
Technical Analysis:
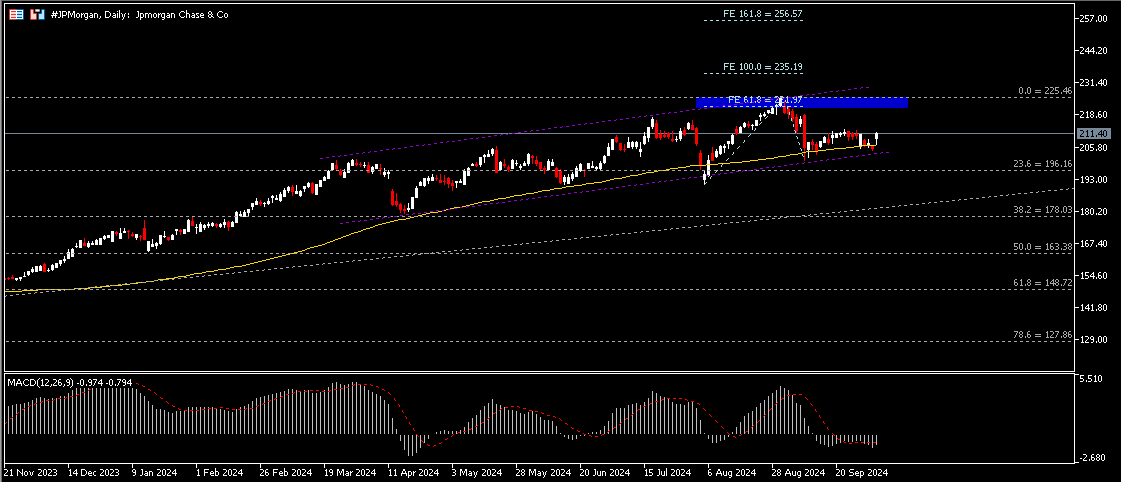
#JPMorgan share price remains supported above 100-day SMA and the bottom line of ascending channel. The asset forms an ATH in late August, at $225.46. Together with $222 (FE 61.8%), these two price levels form the nearest resistance zone. A break above the zone as well as the top line of ascending channel may encourage the bulls to challenge the next resistance, at $235. On the other hand, a break below the said support may indicate technical correction, with focus on the next support at $178 (FR 38.2%).
Click here to access our Economic Calendar
Larince Zhang
Market Analyst
Disclaimer: This material is provided as a general marketing communication for information purposes only and does not constitute an independent investment research. Nothing in this communication contains, or should be considered as containing, an investment advice or an investment recommendation or a solicitation for the purpose of buying or selling of any financial instrument. All information provided is gathered from reputable sources and any information containing an indication of past performance is not a guarantee or reliable indicator of future performance. Users acknowledge that any investment in Leveraged Products is characterized by a certain degree of uncertainty and that any investment of this nature involves a high level of risk for which the users are solely responsible and liable. We assume no liability for any loss arising from any investment made based on the information provided in this communication. This communication must not be reproduced or further distributed without our prior written permission.


