


Tesla, Inc. is a company which engages in the design, development, manufacture, and sales of fully electric vehicles, as well as power storage and photovoltaic systems. It is ranked the 9th most valuable company in the world by market cap at over $670B. The company is scheduled to release its Q4 2023 earnings result on 24th January (Wednesday), after market close.
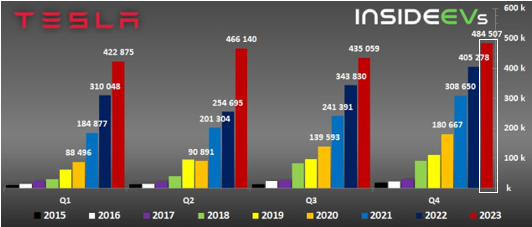
Last Decembere Tesla reported total vehicle production at 494,989, up 13% compared to the same period the previous year. On the other hand, total deliveries hit 484,507, up 20% from the same period the previous year. Model 3/Y reported production and deliveries up +14% (y/y) and +19% (y/y), to 476,777 and 461,538, while other models (including Model S/X, Cybertruck and potentially the Semi) reported production and deliveries down -12% (y/y) and up 34% (y/y) respectively, to 18,212 and 22,969. Throughout 2023, Tesla produced over 1.84 million (up nearly +35% y/y) electric cars worldwide and delivered over 1.80 million (up nearly +38% y/y, but short of the company’s target which was 2 million) electric cars. In general, despite a significant price reduction being deployed, the average growth rate in Q4 has noticeably slowed down, behind the long term target of 50%.
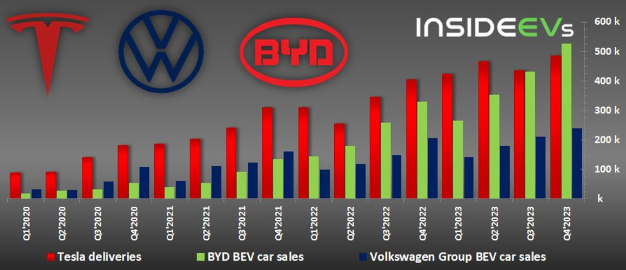
EV adoption is seen flattening following macroeconomic headwinds such as high interest rates and increased competition from the Chinese automakers. In fact, the Chinese EV makers have expanded their market share in the EU market to 8% (could potentially reach 15% by 2025, according to Reuters), benefiting from lower imposed tariffs in the region (10% versus 27.5% in US). On the other hand, starting early 2024, some of the EVs made by Tesla may no longer fulfill the requirement for subsidies in the US and in some European countries – this could further dampen the demand outlook. As of Q3 2023, Tesla’s market share in the global market has fallen to 50% (was 65% in 2022).
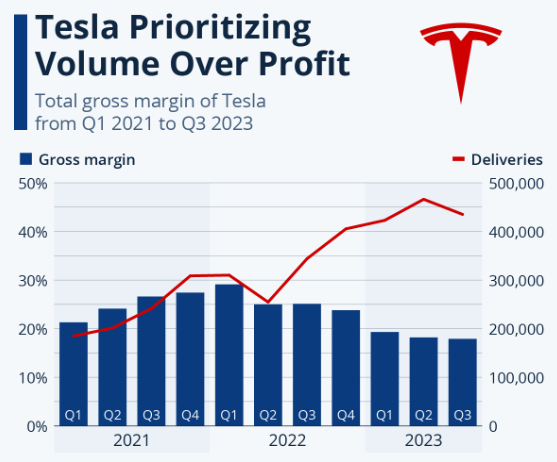
Another worrying issue was the depreciating gross margin of Tesla, which was below 20% throughout 2023. This was attributed to the implementation of massive price cuts for several rounds, underutilization of new factories and an increase in operating expenses on a few projects including Cybertruck, AI, self-driving technology etc.
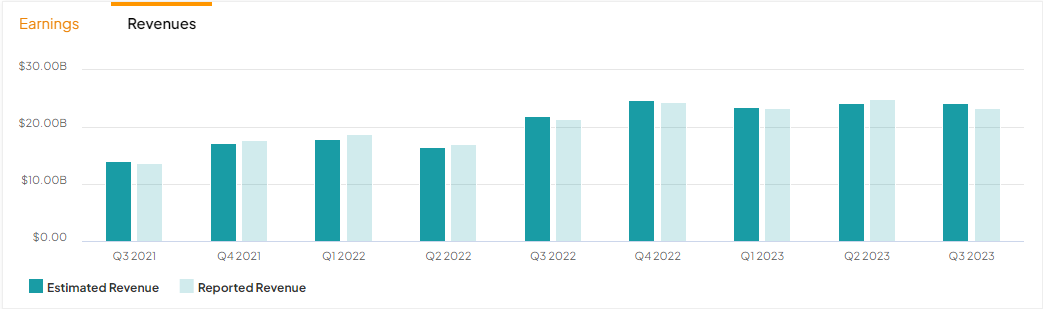
“Revenue is anticipated to become stronger, at $25.5B; EPS projected downward at $0.74; margins likely to remain tested… predicted to improve slightly to around 18%, from 17.89% in Q3” – Refinitiv
Market participants remain neutral on Tesla. Despite less satisfying delivery results, the company pointed out that its energy and services businesses remain robust, which contributed more than $500 million in combined gross profit in the quarter. Its NACS charging port and extensive network of Superchargers serve as a big plus point for the company, which are expected to be adopted by other automakers by late 2024, or early 2025.
Technical Analysis:
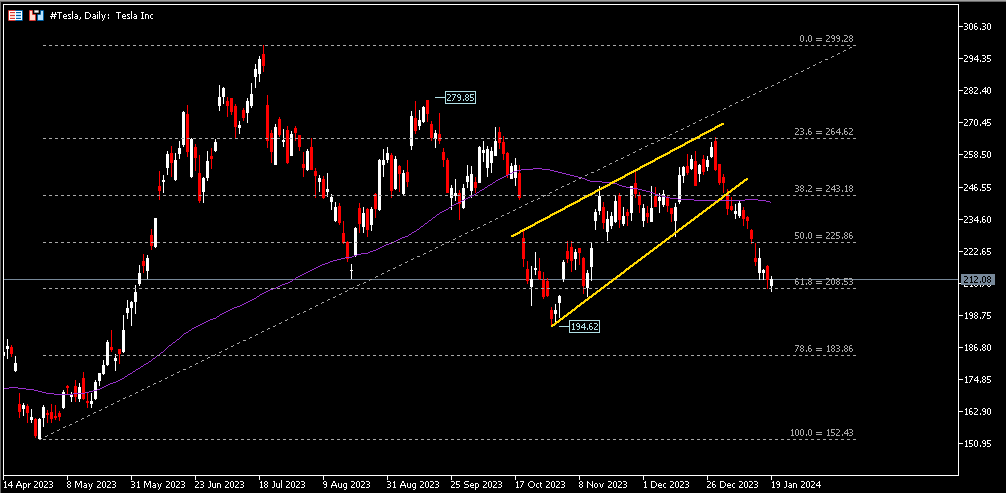
#Tesla shares have been on a selling spree since mid December last year, closing bearish for 5 consecutive weeks. This equates to around an 80% retrace from the bullish rebound in Q4 2023. Nearest support is seen at $208.50, an FR 61.8% extended from the lows of April 2023 to the highs of July 2023. A decisive close below the level shall encourage more selling pressure, towards the lows of October 2023, at $194.62 and $184 (FR 78.6%). On the contrary, $225.90, or the FR 50.0% serves as the nearest resistance, followed by the dynamic resistance 100-day SMA.
Click here to access our Economic Calendar
Larince Zhang
Market Analyst
Disclaimer: This material is provided as a general marketing communication for information purposes only and does not constitute an independent investment research. Nothing in this communication contains, or should be considered as containing, an investment advice or an investment recommendation or a solicitation for the purpose of buying or selling of any financial instrument. All information provided is gathered from reputable sources and any information containing an indication of past performance is not a guarantee or reliable indicator of future performance. Users acknowledge that any investment in Leveraged Products is characterized by a certain degree of uncertainty and that any investment of this nature involves a high level of risk for which the users are solely responsible and liable. We assume no liability for any loss arising from any investment made based on the information provided in this communication. This communication must not be reproduced or further distributed without our prior written permission.


