


Gold and Silver prices ended slightly lower on Friday (15/12). Friday’s strengthening US Dollar weighed on metal prices. In addition, hawkish comments from New York Fed President Williams weakened Gold prices, as he rejected speculation about a Fed rate cut in March.
Looking at the data, the number of initial jobless claims in the US last week was 202,000, compared to the estimate of 220,000. The previous figure was revised up to 221,000 from 220,000. The number of continuing jobless claims in the week of 2 December was 1.876 million, compared to expectations of 1.887 million, and previous claims were revised to 1.856 million from 1.861 million. US retail sales rose 0.3% m/m in November, compared to an expected decline of 0.1%, and the previous data was revised from a decline of 0.1% to a decline of 0.2%. Core retail sales rose 0.2% m/m, compared to an estimated decline of 0.1%, and the previous figure was revised to flat from a rise of 0.1%.
On Friday (15 December), spot gold fell slightly and is currently trading around $2019. Trading on expectations of a rate cut the day before, was let down by the data released. US retail sales and initial jobless claims data were stronger than expected, suggesting that the job market and consumer spending remain resilient.
Expectations of a major Fed rate cut next year eased slightly, despite signals from Powell’s previous statements. As a result, gold prices stopped moving higher and fluctuated widely yesterday. Early last week, gold rose on bullish news, but the news-driven trend was short-lived and intermittent. Currently, the strength of bulls and bears in the 2019 – 2047 range is relatively balanced. In the short term, rate cut expectations are corrected. But in the medium and long term, traders will focus on when and by how much interest rates will be cut. Once global central banks, issue clear signals to cut interest rates, gold will have a clearer direction.
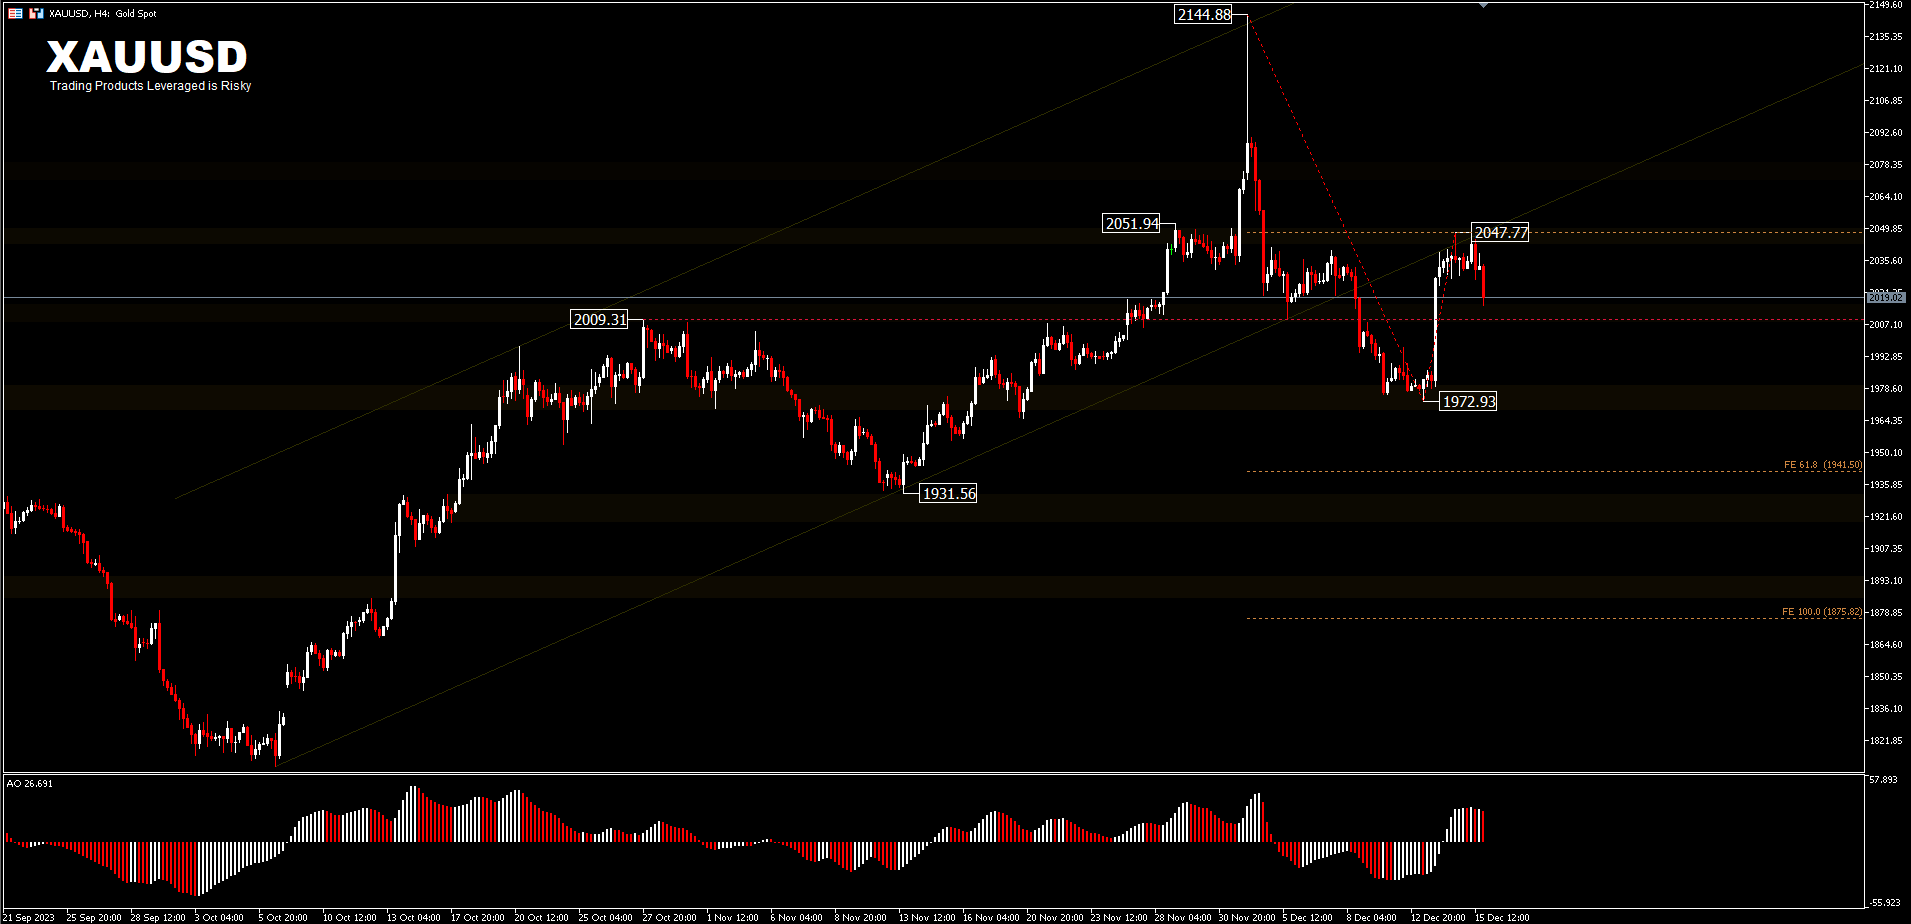
Last week, XAUUSD prices surged to 2047, then fluctuated downwards, falling to a low near 2015. The failure to surpass the 2051 resistance, indicates that the bullish sentiment is not strong enough. Gold prices are likely to move within the range of 2009 – 2047 next. However, a drop below the 2009 resistance level will bring a decline to test the recent low of 1972 and further to the FE61.8% projection of 1941 from 2144 – 1972 and 2047 drawdown.
Meanwhile, silver prices came under pressure, due to industrial metal demand concerns after US manufacturing production in November, US December S&P manufacturing PMI and Japan’s Jibun Bank December manufacturing PMI reports were all weaker than expected. A supporting factor for precious metals on Friday was low global bond yields.
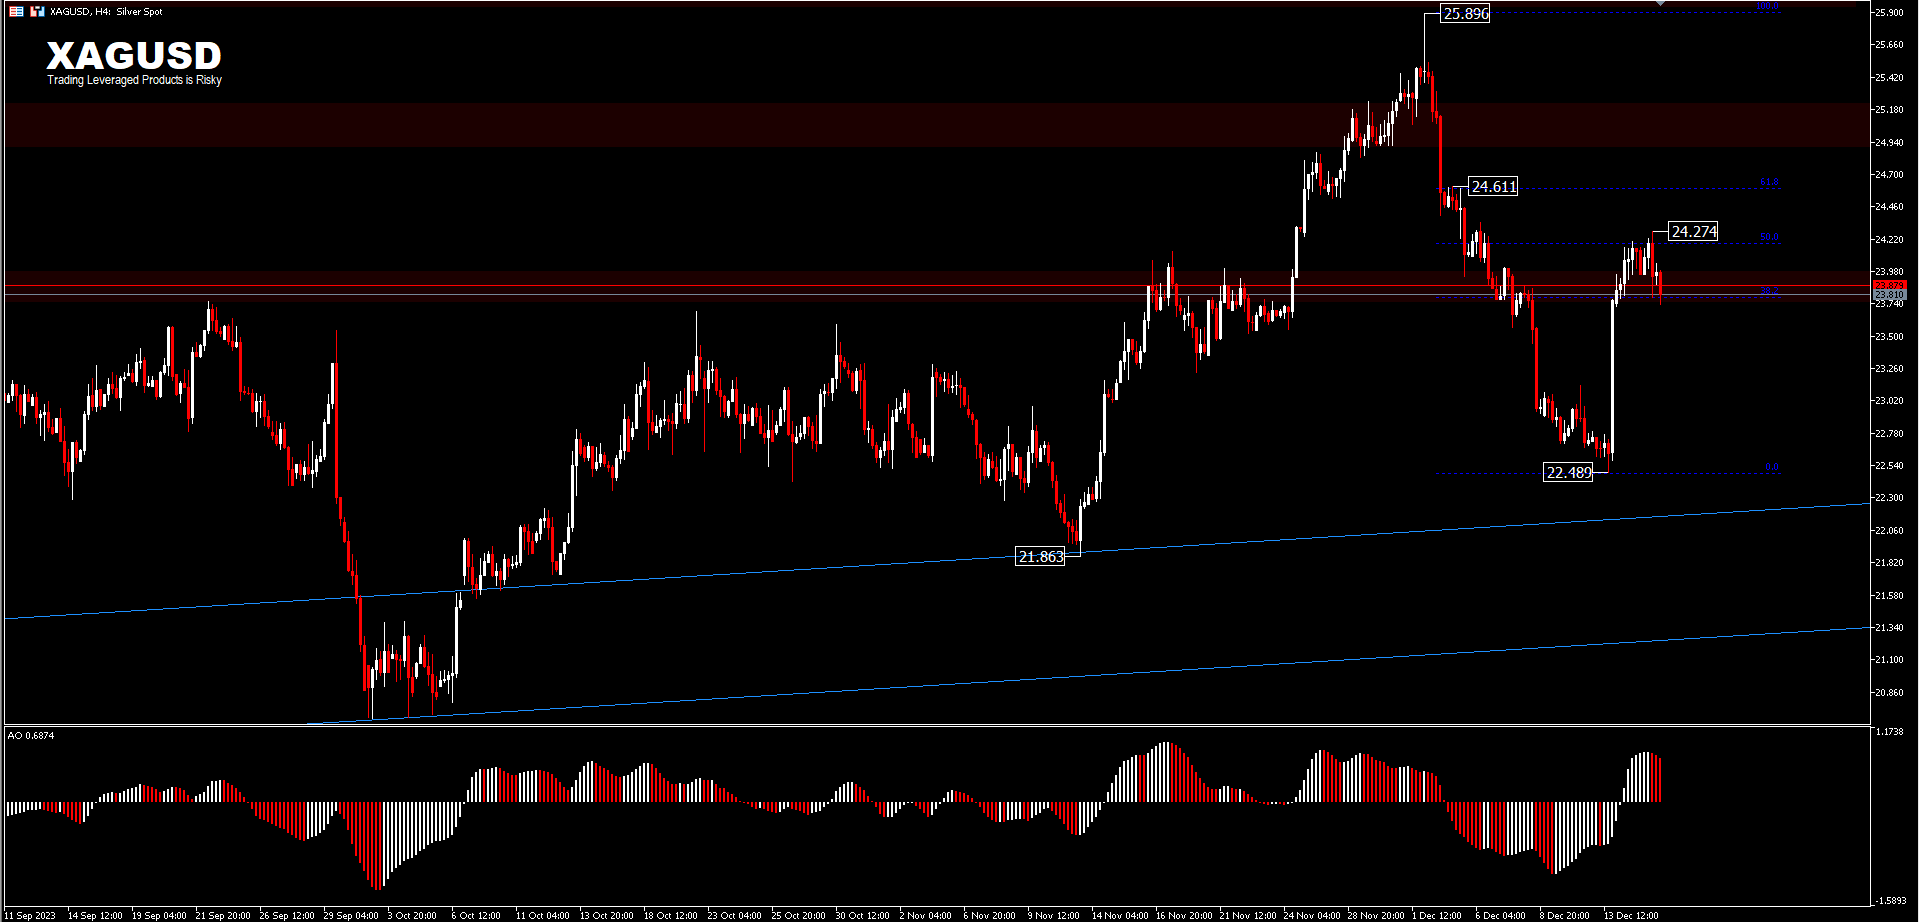
XAGUSD price recorded a 7-month high of 25.89 last week, but since then it has fallen -13% to record a low of 22.48 before a short rebound to cut losses. For the time being, the price looks quite neutral.On the upside, a move above 24.27 could test the 61.8%FR level around 24.66. While on the downside, a continued move opens up the possibility of testing the recent low.
Copper futures rose towards $3.8 per pound, close to a four-month high of $3.92 hit on December 1, tracking other base metals’ gains as dovish projections from the Fed pressured the dollar and supported the outlook for industrial activity. Central bank members increased the number of interest rate cuts projected for next year while revising down its measure of inflation, raising hopes that lower borrowing costs could support manufacturing activity. In addition, the weaker US Dollar increased foreign demand for base metals priced in USD, thereby also driving up their prices.
Supply concerns also supported this trend, as Panama plans to close its First Quantum Cobre mine, thus halting production from a major source of world supply. However, limited demand expectations from China capped the upside, triggered by the lack of stimulus announcements, after a series of policy meetings this week.
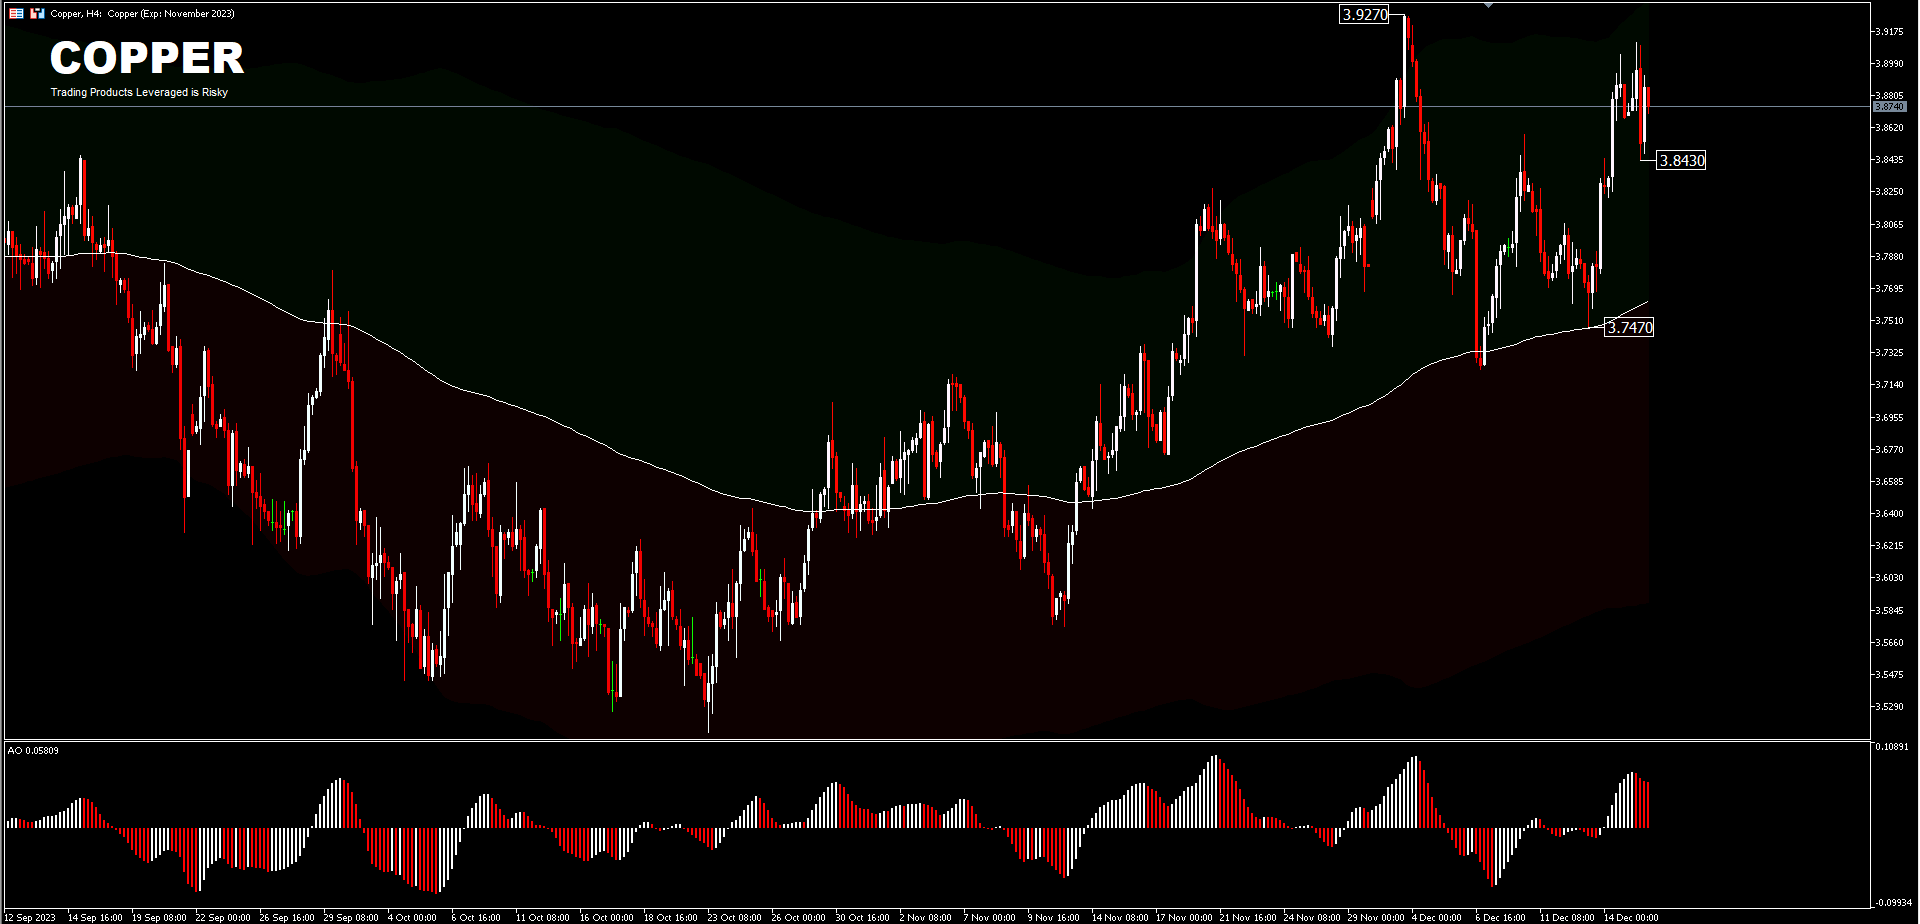
Copper is still on a short-term upward path above the 200-period EMA, and for now it tends to be neutral. A move to the upside could test 3.92 resistance while a move below 3.84 could test 3.74 support.
Click here to access our Economic Calendar
Ady Phangestu
Market Analyst – HF Educational Office – Indonesia
Disclaimer: This material is provided as a general marketing communication for information purposes only and does not constitute an independent investment research. Nothing in this communication contains, or should be considered as containing, an investment advice or an investment recommendation or a solicitation for the purpose of buying or selling of any financial instrument. All information provided is gathered from reputable sources and any information containing an indication of past performance is not a guarantee or reliable indicator of future performance. Users acknowledge that any investment in Leveraged Products is characterized by a certain degree of uncertainty and that any investment of this nature involves a high level of risk for which the users are solely responsible and liable. We assume no liability for any loss arising from any investment made based on the information provided in this communication. This communication must not be reproduced or further distributed without our prior written permission.


