


Understanding the USDZAR pair involves considering various factors that impact its dynamics. These include the US dollar’s strength, the South African rand’s sentiment, global risk appetite, and economic and political developments in both regions. Let’s explore these aspects to shed light on this currency pair.
The South African Rand’s movement is closely connected to the US Dollar’s performance. The Dollar acts as a safe haven during uncertain times, attracting investors seeking stability and returns. However, the Rand also responds to global economic sentiments and demand for commodities, which are major exports for South Africa. The recent global risk aversion and fluctuations in gold prices have affected the Rand’s performance.
The USDZAR pair faces additional complexities. The Rand deals with challenges such as public debt, slow growth prospects, and social unrest in South Africa.
Shifting our focus to technical analysis, the current state of the pair is worth noting. At 19.0440, it has seen a 0.57% increase in the trading day, with an upward trend over the past months, reaching 19.1635 on August 14. While consolidation and profit-taking are apparent, the overall sentiment remains bullish.
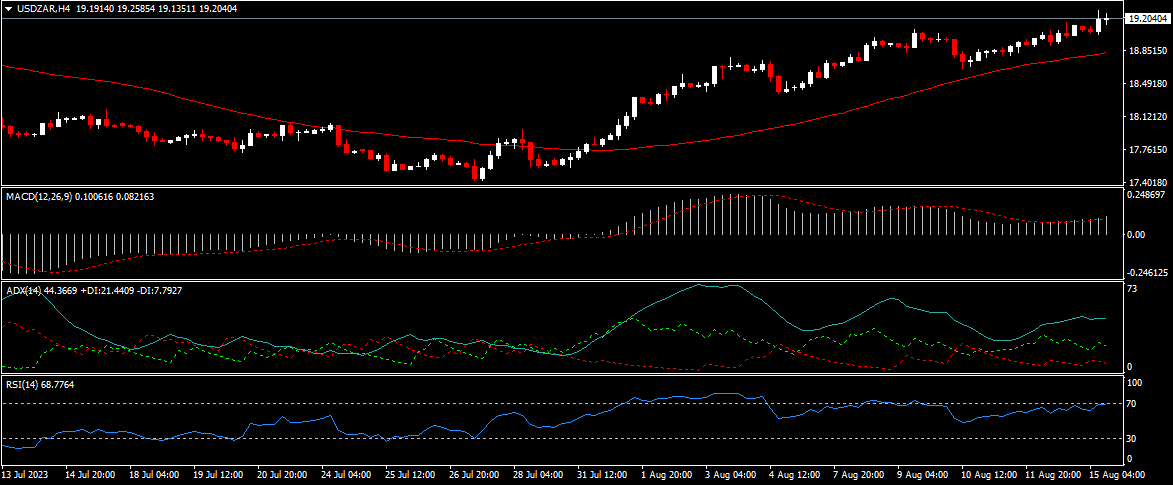
Technical indicators on the 4-hour chart show positive signals. Moving averages are aligning upwards, with the 50-day MA (18.8260) acting as a dynamic support level. The MACD indicates momentum above the zero-line and rising. The ADX is above 25 and rising, suggesting a robust trend, and the RSI oscillator is above 50 and below 70 showing upward pressure without overextension.
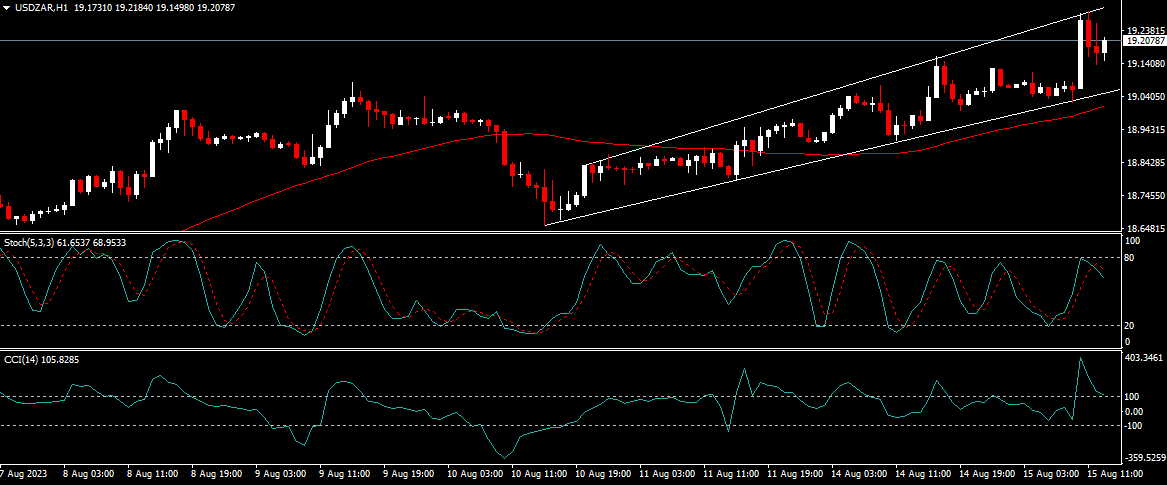
On the 1-hour chart, a broadening wedge pattern emerges, suggesting bullish continuation. The pair has rebounded from the lower boundary at 18.9450 and is nearing the upper boundary at 19.2500, hinting at a potential rise towards resistance levels such as 19.3000 and 19.5000, should the pattern be broken.
Despite these positive signals, caution is needed. The prior peak at 19.1335 could pose resistance, and the stochastic oscillator in the overbought zone is suggesting a potential correction. The CCI index crossing 100 indicates overbought conditions, signalling a need for vigilance.
Click here to access our Economic Calendar
Francois du Plessis
Market Analyst
Disclaimer: This material is provided as a general marketing communication for information purposes only and does not constitute an independent investment research. Nothing in this communication contains, or should be considered as containing, an investment advice or an investment recommendation or a solicitation for the purpose of buying or selling of any financial instrument. All information provided is gathered from reputable sources and any information containing an indication of past performance is not a guarantee or reliable indicator of future performance. Users acknowledge that any investment in Leveraged Products is characterized by a certain degree of uncertainty and that any investment of this nature involves a high level of risk for which the users are solely responsible and liable. We assume no liability for any loss arising from any investment made based on the information provided in this communication. This communication must not be reproduced or further distributed without our prior written permission.


