Today new consumer inflation data awaits with the release of CPI and Core CPI readings for July 2023. The expectation is for a headline y/y number up from last month (+3.3% in July vs. +3% in June) against a slightly lower core one (+4.7% vs. +4.8%). Truly, the reason for the rise is also purely mathematical since m/m the CPI had stayed flat in Lug 2022.
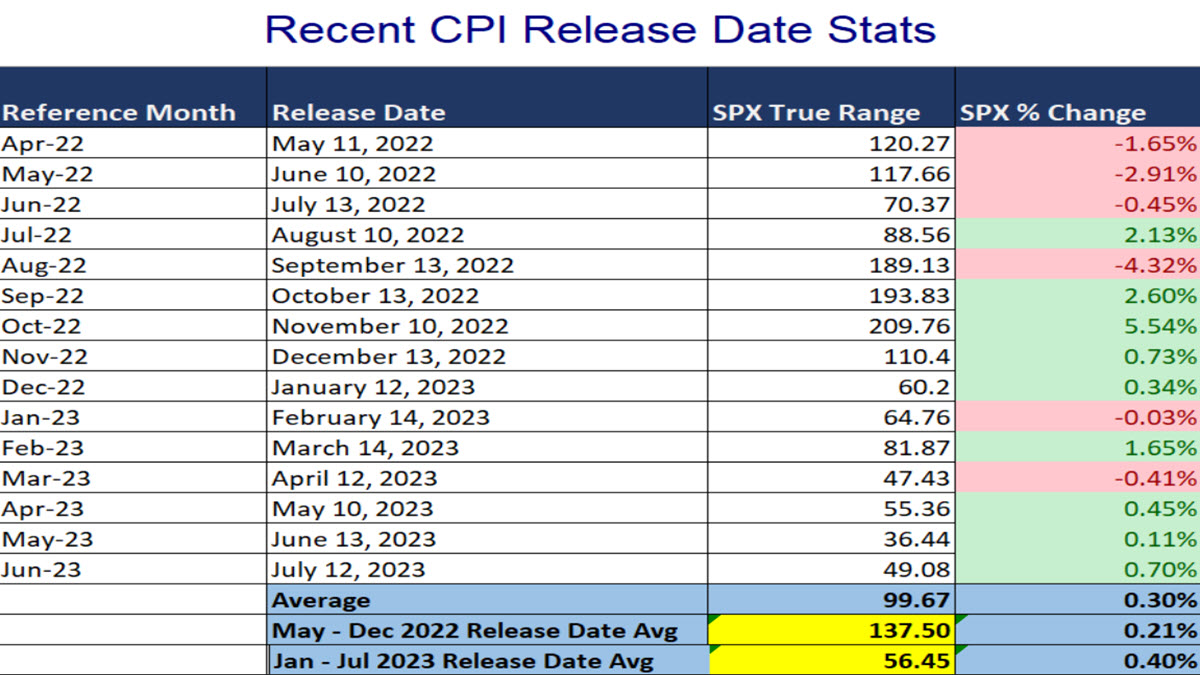
The descent of inflation is no longer a surprise to anyone and this can be clearly seen in the previous table showing the performance of the SP500 on the day of the release: volatility is clearly on a downward trend with a True Range of just over 1% during 2023 ($56.45 average movement) against excursions close to 3% during the last 7 months of 2022.
But here’s where something interesting comes in: the concept of nowcasting (as opposed to forecasting) is increasingly in vogue and various FED Banks have developed models for this: in particular, the Cleveland FED uses a model to track inflation. In it the CPI is seen to rise even more (+3.4%) and the core is also seen to rise (to 4.9%). Not that these numbers are a tremendous shock – we have recently traced how many commodities have been rising in the last two months – but why might there be this slight spike up?
Cleveland Fed Inflation Nowcasting Projections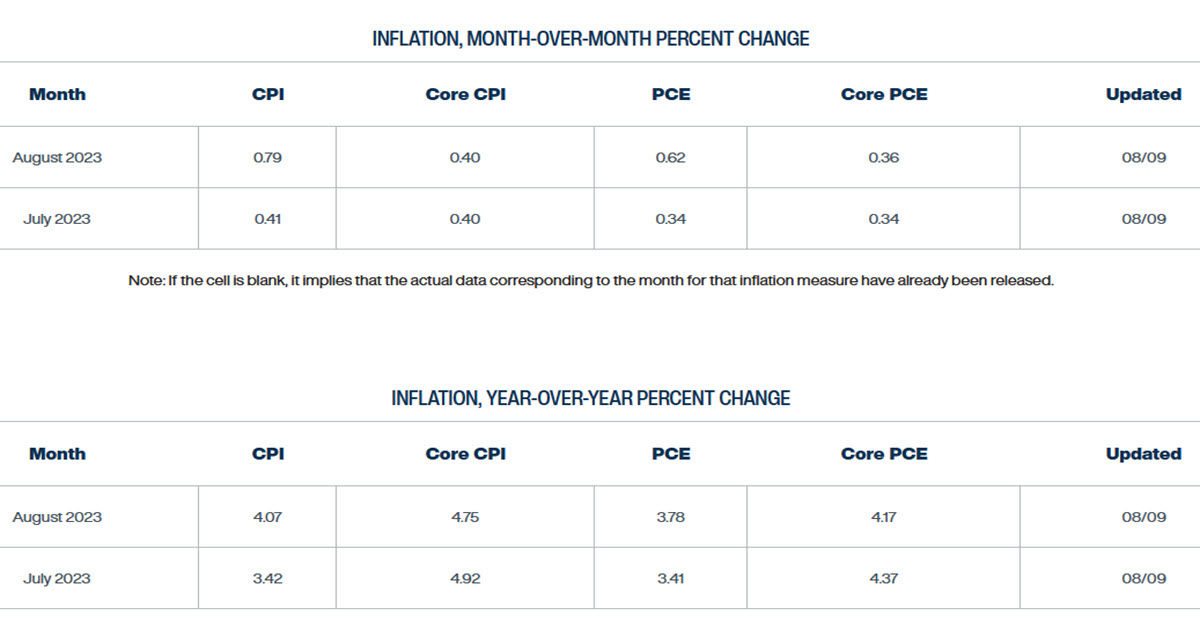
We are in the realm of speculation, but recent indications from US airlines show that Americans still prefer spending money on experiences rather than shopping: in fact airlines and hotel chains in recent weeks have reported a surge in bookings and rising prices while theme park operators and restaurants are also seeing good traffic. It seems that Americans are being very careful where and how they are spending their money in an age of rising prices but they still do not want to give up enjoying their free time whenever possible.
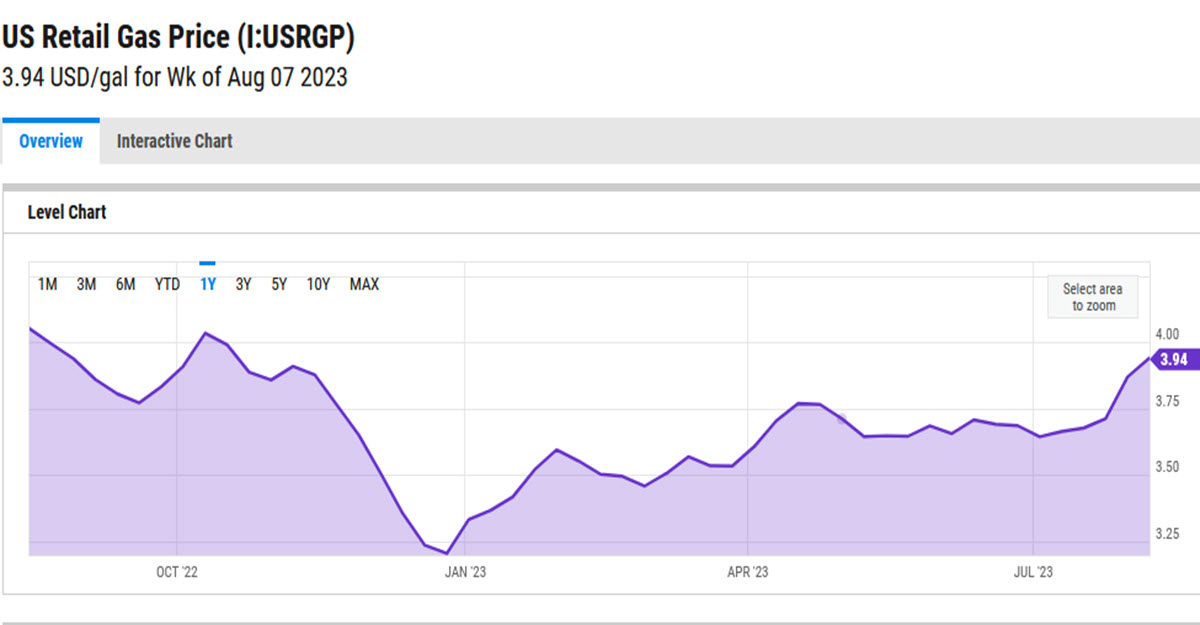
And with all this wanderlust, take into account that the price of a gallon of petrol in the US is at its highest of the year, $3.94.
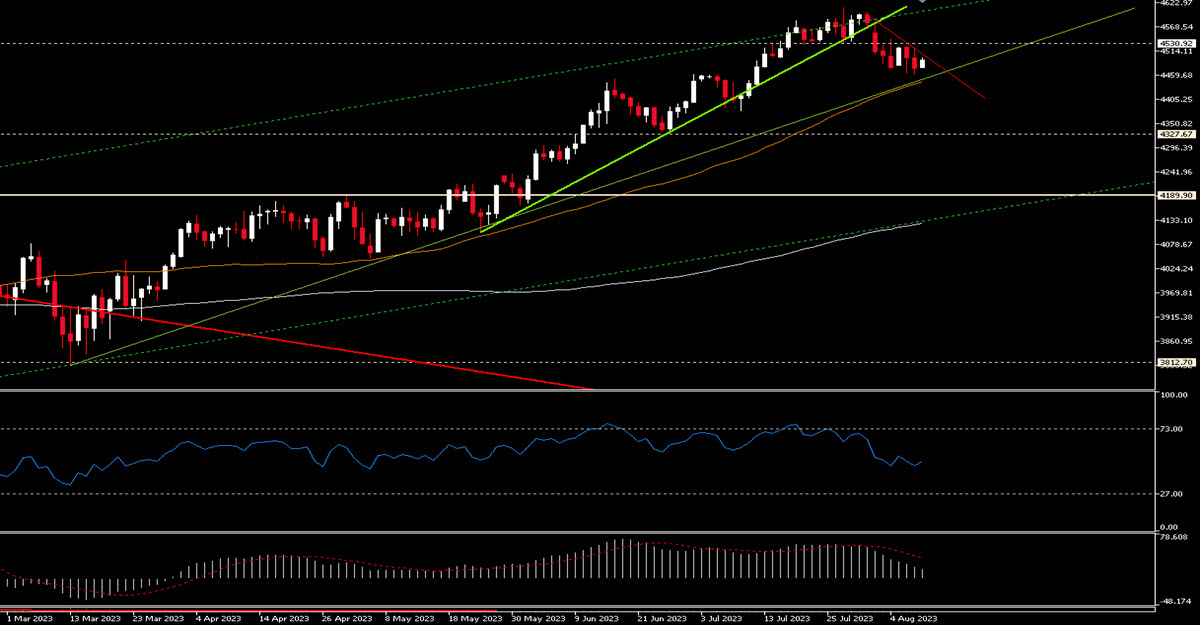
How might the US500 react? Well, we have just seen that recently the average movement on days like these has been around $45, but a surprise to the upside could definitely increase this range. The index is cooling off and is down 2.5% from the highs of 2 weeks ago but more importantly it is approaching the trendline that has supported prices since March and its MA 50. Currently these 2 structures are close to $4450 (trading at $4488 right now). Upwards the trendline which is pulling the index down is passing at $4507 today.
Click here to access our Economic Calendar
Marco Turatti
Market Analyst
Disclaimer: This material is provided as a general marketing communication for information purposes only and does not constitute an independent investment research. Nothing in this communication contains, or should be considered as containing, an investment advice or an investment recommendation or a solicitation for the purpose of buying or selling of any financial instrument. All information provided is gathered from reputable sources and any information containing an indication of past performance is not a guarantee or reliable indicator of future performance. Users acknowledge that any investment in Leveraged Products is characterized by a certain degree of uncertainty and that any investment of this nature involves a high level of risk for which the users are solely responsible and liable. We assume no liability for any loss arising from any investment made based on the information provided in this communication. This communication must not be reproduced or further distributed without our prior written permission.