


Well, of course someone has noticed: first of all, the borrowers of variable-rate mortgages who have seen their repayments skyrocket, or those who would like to apply for a new one or refinance their old one. In the US the official mortgage rate has reached 7.09%, in the UK the rates on 2-year and 5-year loans are both well above 6%.
Even small and medium-sized companies – those who cannot issue debt – have seen their costs skyrocket and some have simply been excluded from the possibility of a bank loan (especially in Europe as the ECB noted in its latest survey). But the SP500, the stock indices, seem not to have noticed.
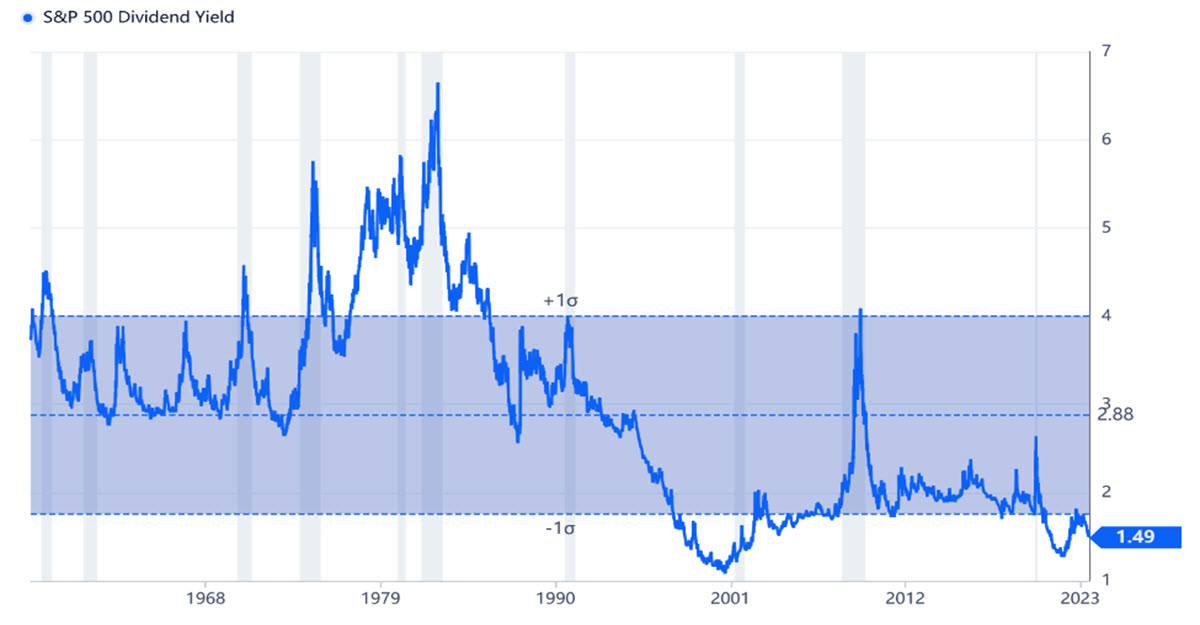
The above chart shows the Dividend Yield on US500: it is the average yield that an investor can get from the dividend paid by the stocks included in this index. It sits at 1.49% right now, well below the long-term average (2.88%); the chart shows that it is about 1 sigma, 1 standard deviation below the average. This is a very low level, similar to what has been reached between the bursting of the tech bubble at the beginning of the millennium and the GFC. It has been rather low for a while now actually; during the whole 10s decade, it hovered around 2%. But back then the interest rates – the money you could earn by buying the lower-risk debt securities (bonds, bills, notes) – were 0% or negative. In short, much less than now.
Take Warren Buffett: he is known to be a long-term investor, not interested in even deep fluctuations in the share price. What he is looking for is a steady and secure flow of income over the years from what the stock pays – dividends.
The same is true for many institutional investors, especially funds. For them, the choice is between different asset classes – as well as between different companies: why settle for an average of 1.49% when buying one-year US debt can get you 5.4%? And if you are based in Europe, you can buy 1-year Italian BOT at 3.8%? The situation was certainly not the same 3 years ago. Yet, indices are still bought strongly.
US100 vs. Inverted 10Y Yield
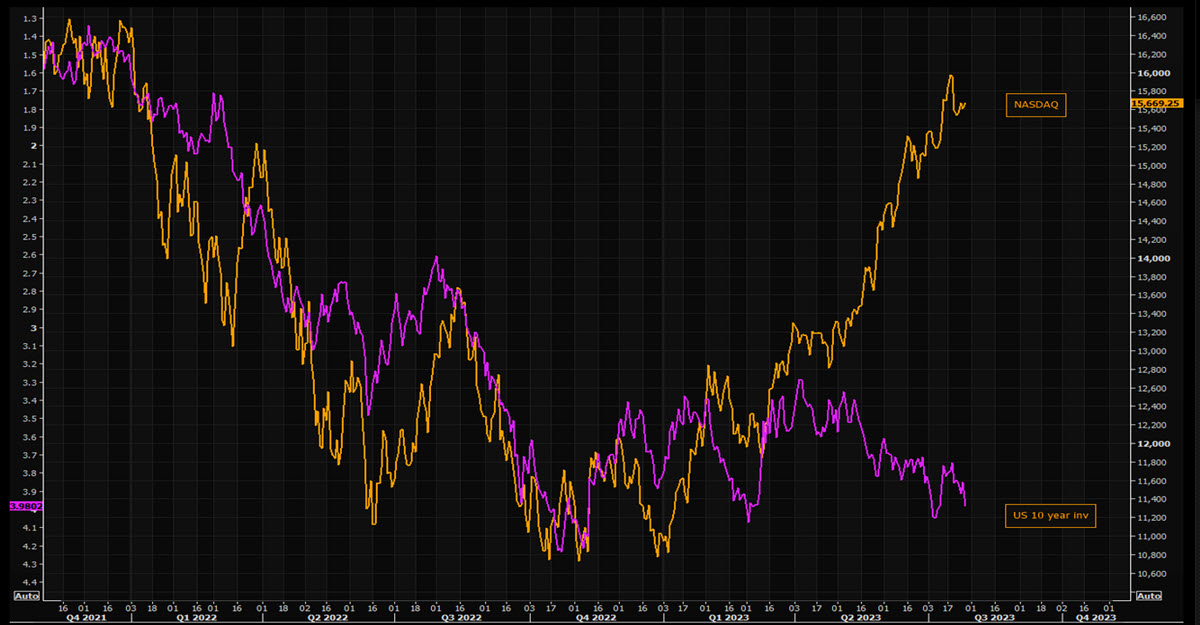
The above chart shows the divergence between US100 prices and the (inverted) US 10y yields, generally well correlated because of the dependency of many growth stocks on future expected cash flows: has this divergence broken? Are we in a new normal? Or are we set for a classical mean reversal move at some point?
Click here to access our Economic Calendar
Marco Turatti
Market Analyst
Disclaimer: This material is provided as a general marketing communication for information purposes only and does not constitute an independent investment research. Nothing in this communication contains, or should be considered as containing, an investment advice or an investment recommendation or a solicitation for the purpose of buying or selling of any financial instrument. All information provided is gathered from reputable sources and any information containing an indication of past performance is not a guarantee or reliable indicator of future performance. Users acknowledge that any investment in Leveraged Products is characterized by a certain degree of uncertainty and that any investment of this nature involves a high level of risk for which the users are solely responsible and liable. We assume no liability for any loss arising from any investment made based on the information provided in this communication. This communication must not be reproduced or further distributed without our prior written permission.


