


The US500 has been stuck in a tight range close to this year’s highs for 33 trading sessions now, since the beginning of Q2. It has traded mostly between 4100 and 4150 with some (very) short-lived excursions towards both 4175 and 4050. No wonder, with the future of so many macroeconomic factors uncertain: the latest element to be added to the puzzle was the debt ceiling debate.


HFM · US500 remains indecisive as Money Markets continue to grow
Janet Yellen recently stated that the US could default on its debts as early as the beginning of June, and this has helped to push the short-end of the US curve even higher.
Right now, the 1 month US T-bill is yielding 5.55%, 47 bps above the Fed Funds, and that’s because of the higher perception of risk. 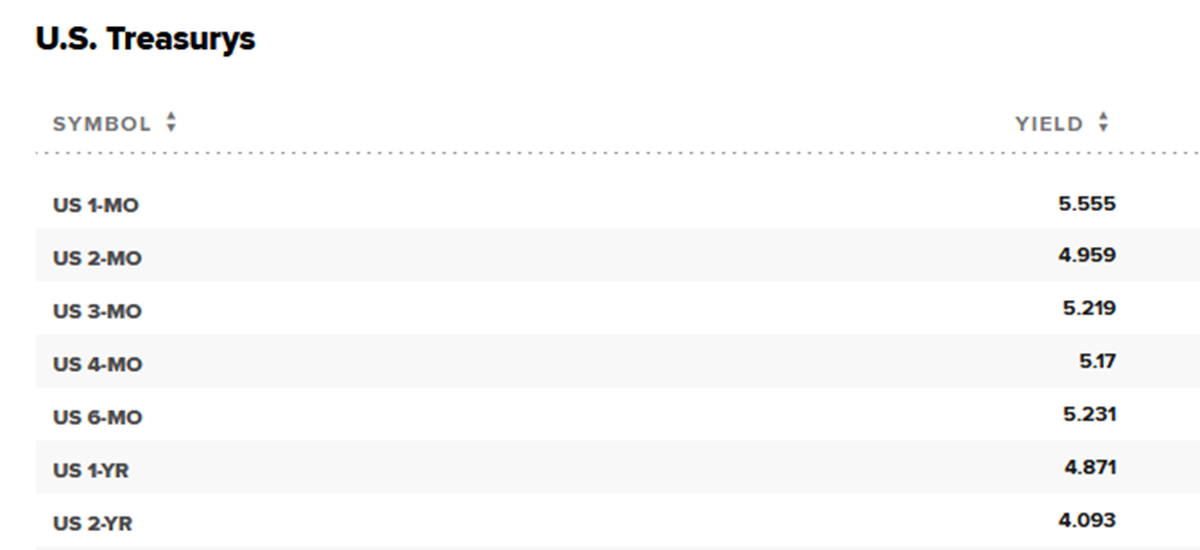
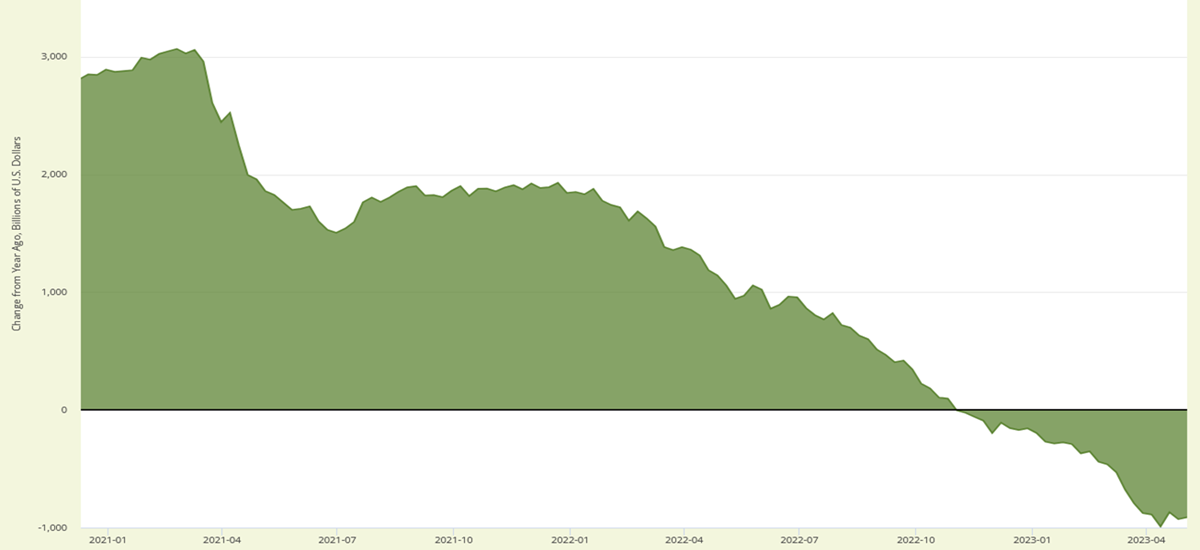
Data shows that Americans had already started withdrawing money from the banking system when rates started to rise while their bank account yields did not, before the significant outflows after SVB and Signature Bank crisis when customers withdrew nearly $100 billion in 1 week from regional banks.
Yearly Change, Billions, Deposits, All Commercial Banks. Fred
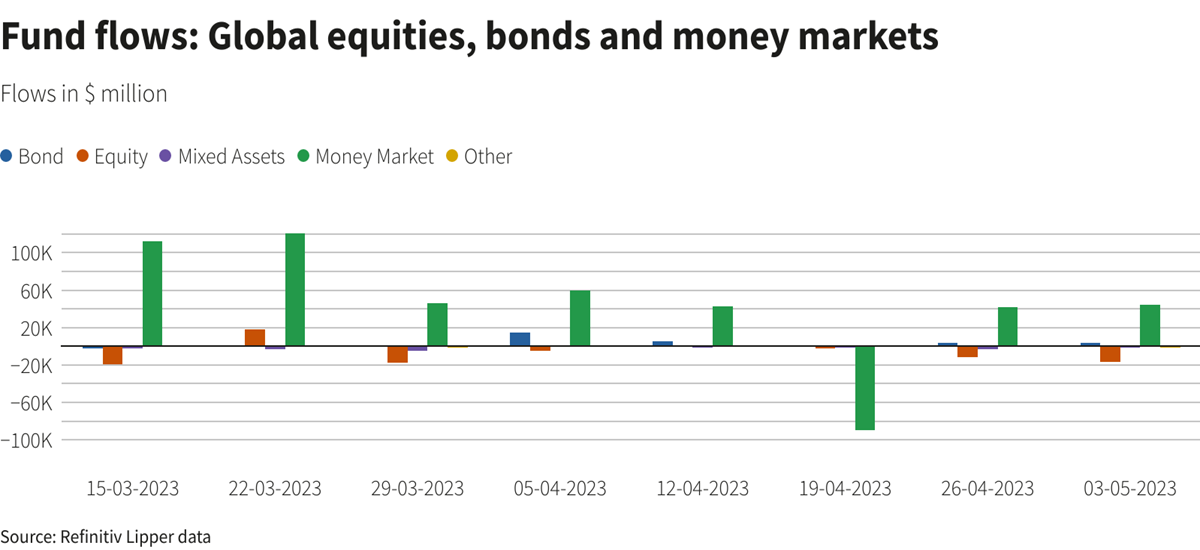
And where did all this money end up? Apparently, not so much towards stocks or bonds but towards Money Market (MM) Funds. These are a type of mutual fund that invests in high-quality, short-term debt instruments, cash, and cash equivalents – things like the 1-month US T-bill. A deeply safe, liquid, almost cash equivalent product. And which currently offers more than decent returns.
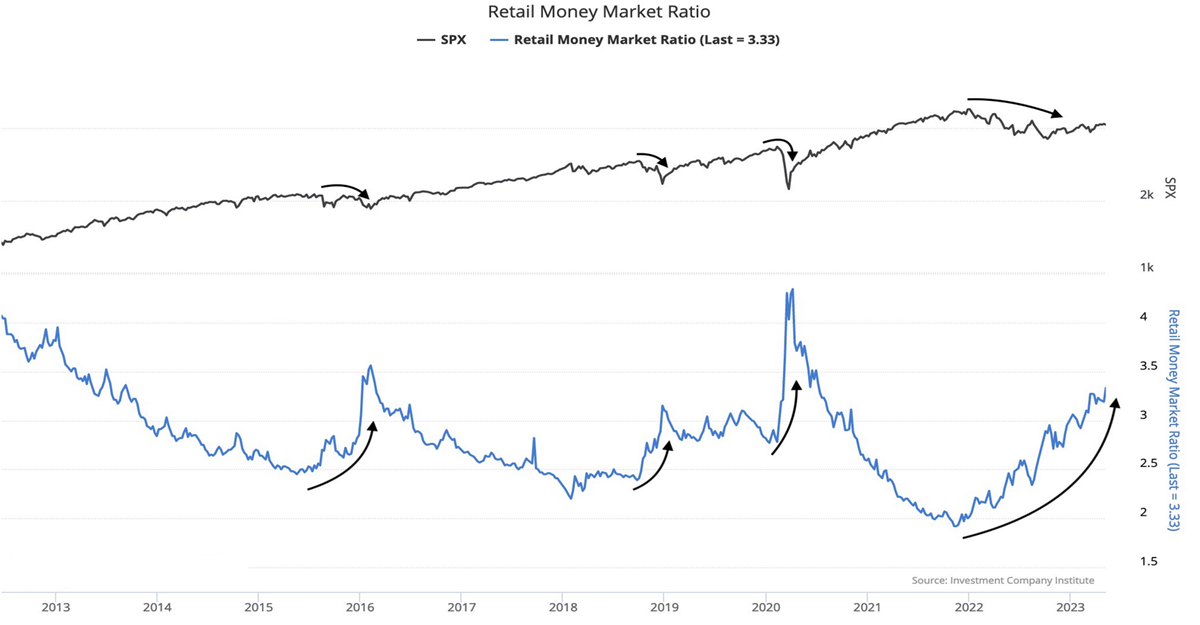
Obviously, people are very attracted by these kinds of returns, which could go even higher in the next few weeks. A study by ICI that related the growth of MM among retailers to the long-term performance of the US500 showed that it is quite clear that when money is shifted massively into a cash-like product with a very low risk profile, the US500 suffers, sometimes heavily. One has to wonder if being -13% from ATH is a full discount of these flows or not.
Retail MM Ratio vs SP500
Technical Analysis
The easiest interpretation of the price action of the index is that it has clearly broken the bearish (red) trend that started at the end of 2021: it has risen 18% since the October 2022 lows, it is above the MA200 and the MA50 is positively tilted; the RSI (14) is at 55 and the MACD is positive.
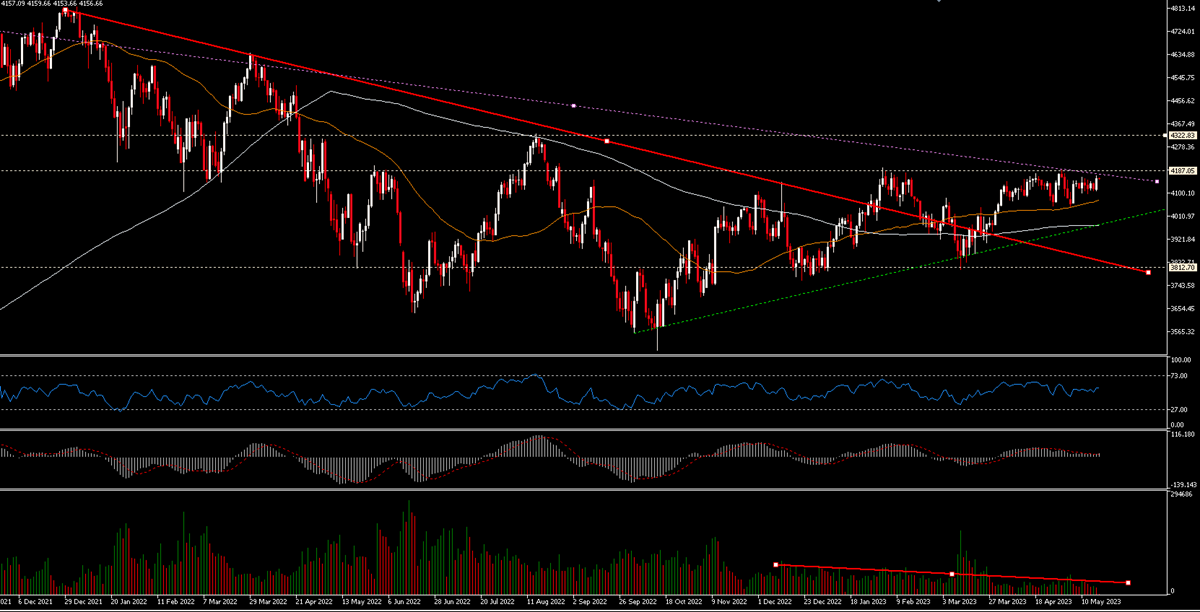
HOWEVER, volumes have been dropping as the price has been pushing higher, which is not a great sign. In order to always have an alternative scenario available, we want to try to consider the possibility that the long-term downtrend might be even less inclined than previously thought and represented by the Purple Channel. The US500 is trading close to the upper part of the Purple Channel, which is currently in the 4190 area where the most immediate and strongest resistance is as well. If these levels are broken upwards there will probably be room towards 4325 to start with. If instead the current range is broken down (below 4050), the first test would be the green uptrend (currently around 4000) and then maybe 3910, 3860.
What is certain is that the stasis within the 4050-4175 range will not last forever and the direction of the break-up will give a fairly clear indication of the next leg.
Click here to access our Economic Calendar
Marco Turatti
Market Analyst
Disclaimer: This material is provided as a general marketing communication for information purposes only and does not constitute an independent investment research. Nothing in this communication contains, or should be considered as containing, an investment advice or an investment recommendation or a solicitation for the purpose of buying or selling of any financial instrument. All information provided is gathered from reputable sources and any information containing an indication of past performance is not a guarantee or reliable indicator of future performance. Users acknowledge that any investment in Leveraged Products is characterized by a certain degree of uncertainty and that any investment of this nature involves a high level of risk for which the users are solely responsible and liable. We assume no liability for any loss arising from any investment made based on the information provided in this communication. This communication must not be reproduced or further distributed without our prior written permission.


