Yesterday’s post included the below analysis. In light of more recent labor data ouf of New Zealand, we are now revising our analysis.
Meanwhile in the forex market, New Zealand Dollar has consolidated with a near 1% loss versus the US Dollar on the day so far, however it remains close to 7-month high above the 61.8% fib. level from the downleg seen in December. The pair remains above all 3 daily MA, with immediate Support at 0.6820. If it sustain gains above this area within the week, more of upside momentum is expected. A break of the latter however could trigger attention towards 200-day SMA, at 0.6760. To the upside, Resistance holds at 3-day highs and day’s R1 at 0.6910.
The New Zealand Dollar reverted the month’s positive outlook overnight, after the announcement of the weaker than expected Labor data. The unemployment rate reported at 4.3% from 4.0% in Q3 and its forecast at 4.1%. At the same time employment was well below projections, as it grew by just 0.1% in contrast to the 1.1% in Q3 (q/q, sa).
This weak report complies with RBNZ’s pledge to keep the rate at the current level through 2019 and 2020.
The overnight miss pushed NZDUSD to a 12-day low, at 0.6743, putting the pair below all 3 daily moving averages. This strong downleg broke all Support levels stated yesterday, converting the near term outlook into negative.
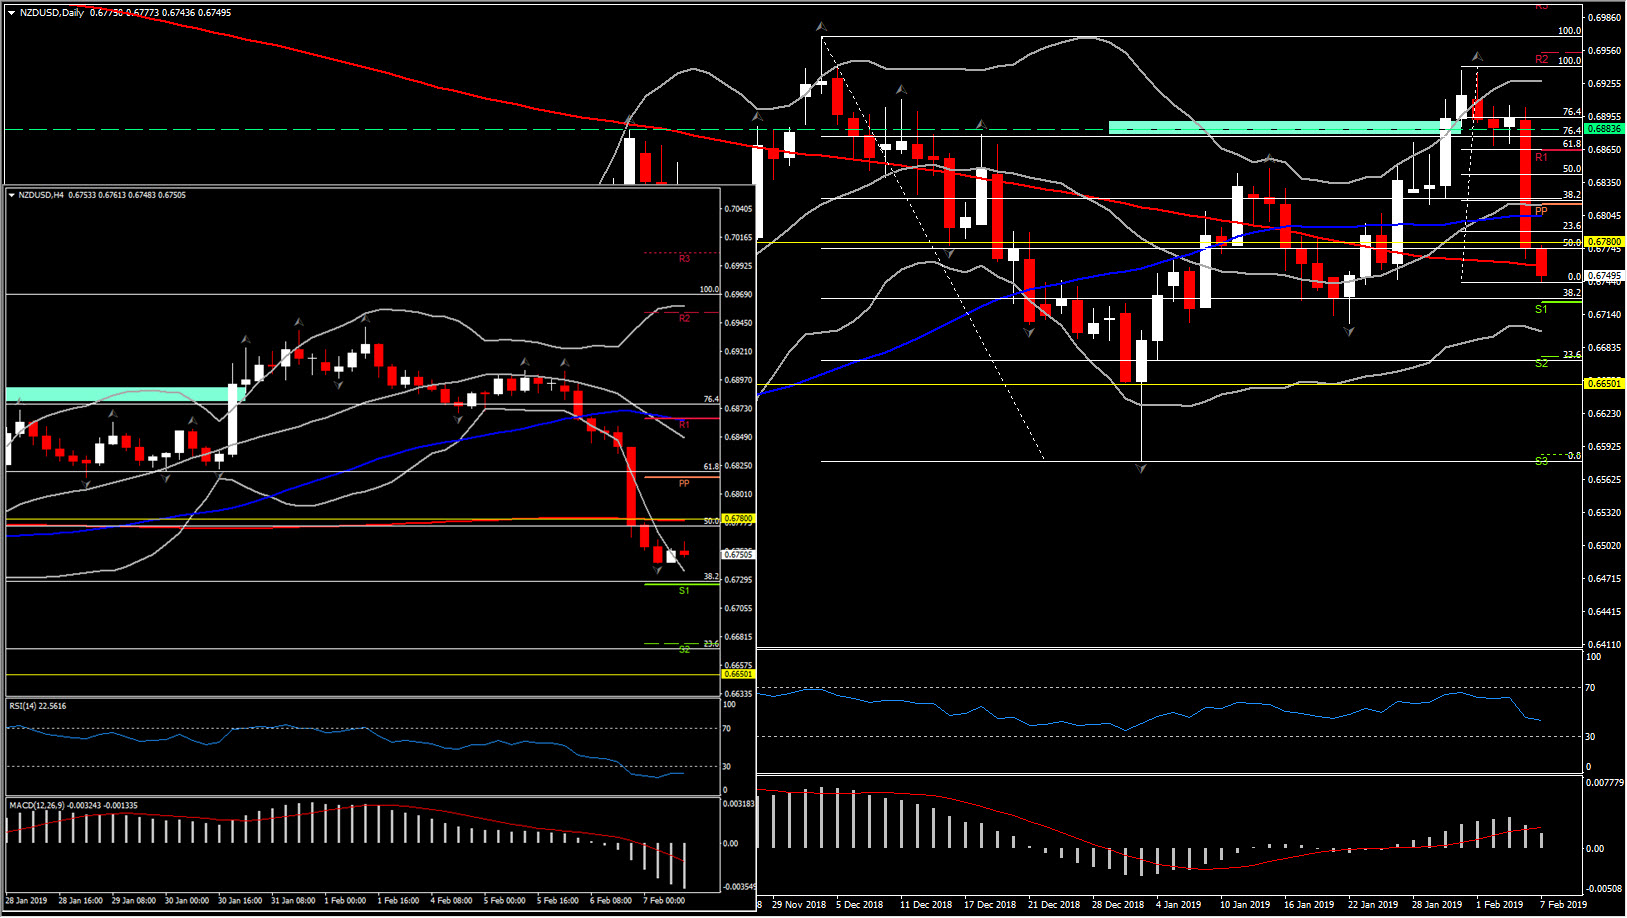
Currently NZDUSD is currently retesting the 200-day SMA at 0.6760, without any significant positive bias so far today. As 20- and 50-period SMA posted a bearish cross in the 4-hour chart, while momentum indicators are configured negative, the day’s picture remains negative, with next immediate Support at 0.6725, which is the confluence of S1 and 38.2% Fib. level set in December. RSI is moving within the oversold area and MACD lines are extending to the downside, suggesting the increase of negative bias. Further losses below 0.6725, could lead the pair towards 0.6580-0.6650 area.
To the upside only a move above 0.6850 (midway of yesterday’s crash) could shift the asset further higher. In the short term Resistance comes at 0.6780 (200-period SMA and the latest up fractal in 1-hour chart).
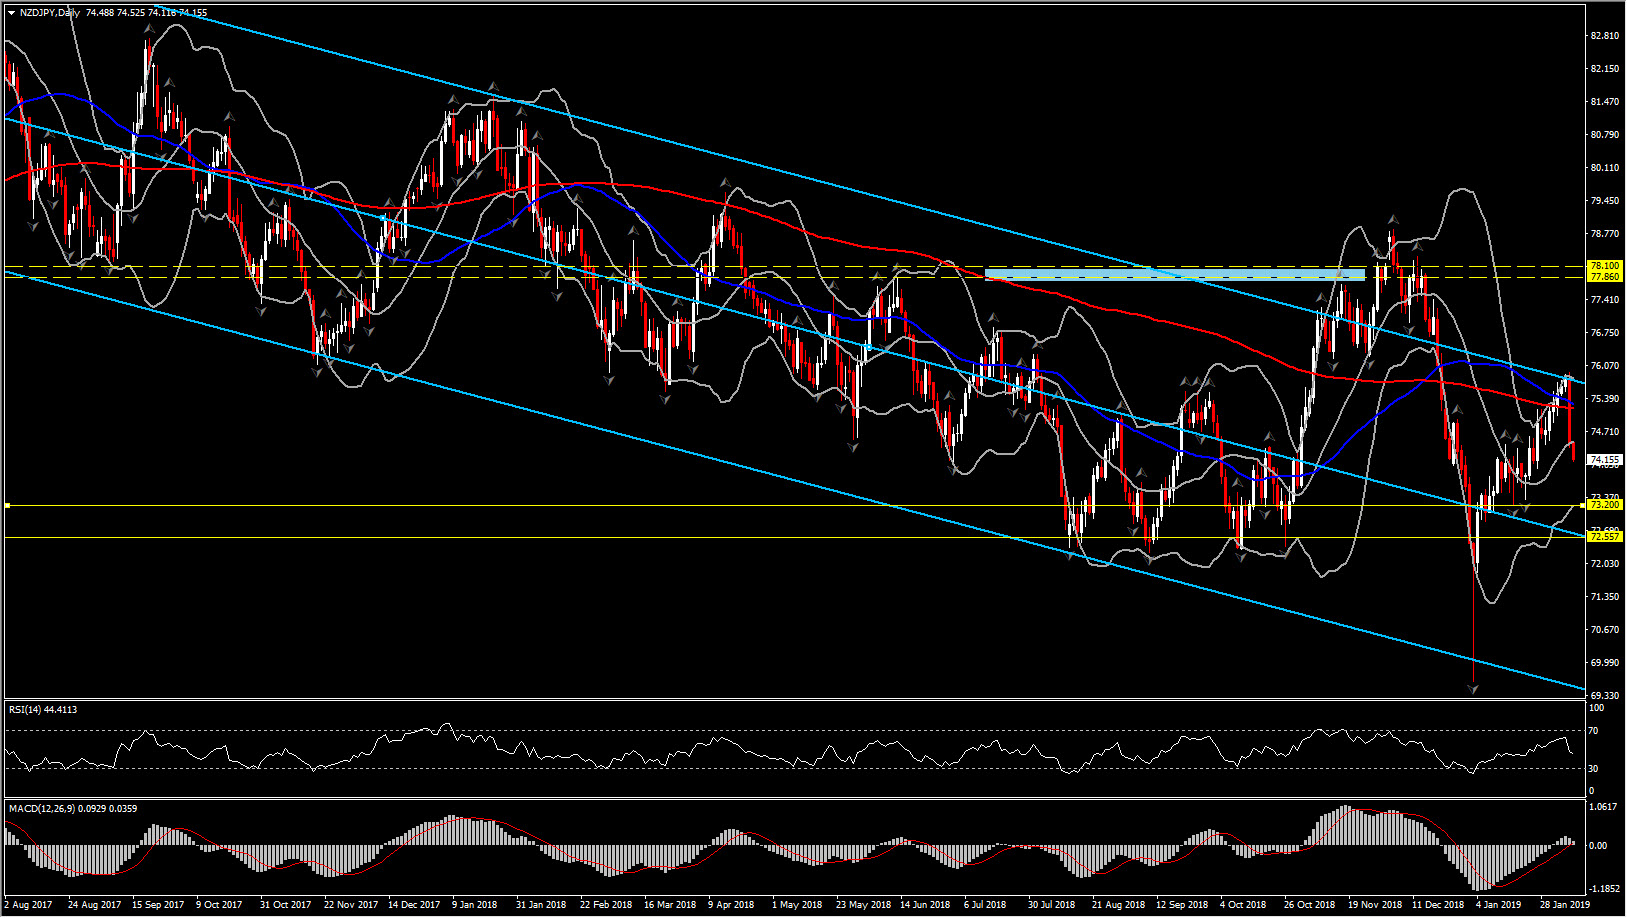
Other than Greenback, Kiwi faced the biggest dive against Yen. NZDJPY rejected the 75.90 high and is currently sloping by 180 pips lower, below 20-day SMA. The rejection of that level signifies a move away from the upper Bollinger Bands pattern but significantly from the upper level of the 18-month downchannel. Hence a close today below the 20-day SMA at 74.50, could open the doors towards the lower Bollinger Bands pattern and the mid line of the channel, at 0.7320 and 0.7255 respectively.
Click here to access the Economic Calendar
Andria Pichidi
Market Analyst
Disclaimer: This material is provided as a general marketing communication for information purposes only and does not constitute an independent investment research. Nothing in this communication contains, or should be considered as containing, an investment advice or an investment recommendation or a solicitation for the purpose of buying or selling of any financial instrument. All information provided is gathered from reputable sources and any information containing an indication of past performance is not a guarantee or reliable indicator of future performance. Users acknowledge that any investment in FX and CFDs products is characterized by a certain degree of uncertainty and that any investment of this nature involves a high level of risk for which the users are solely responsible and liable. We assume no liability for any loss arising from any investment made based on the information provided in this communication. This communication must not be reproduced or further distributed without our prior written permission.