


Recent weakening of commodity prices and signs of slowing economic growth tempered market expectation over the Fed’s rate hike. Among metals, copper suffered the largest weekly fall within the year, at over -6%. In energy sector, UK gas and natural gas are down over 15% and 10% respectively, while crude oil also closed lower for the third consecutive week, down nearly 2%. Some products from agricultural and industrial sectors were also down (Source: Trading Economics).
Signs of economic recession hit market sentiment; participants are now pricing in for the benchmark rate to 3.5% (previously 4.0%) by March next year. Rising recession risk in general affects the outlook for the Fed’s monetary policy, thus lifting the Wall Street’s main indices: S&P500 up +3.46% to 3912, while the Nasdaq and Dow Jones were up 3.75% and 3.03% to 12087 and 31482, respectively. “All 11 of the benchmark index’s sectors ended at least 1.5% higher”.
In addition, most of the US banks stock prices surged higher following the sector passing the Fed’s annual stress test – a report that probes a bank’s capability to maintain enough capital to weather a severe economic downturn. Unlike some major banks, which are expected to increase their stress capital buffers (SCB), Wells Fargo SCB is likely to remain almost unchanged from last year – This explains Wells Fargo being the winner out of its rivals, with gains over 6% intraday.
Wells Fargo is expected to release its Q2/2022 earnings announcement on 15th July. Market consensus for sales revenue stood at $17.79B, up +1.14% (q/q) but down -13.9% (y/y). Earnings per share (EPS) is expected to hit $0.92, up 4.55% from previous quarter but down nearly 49% from the same period last year.
Technical Analysis:
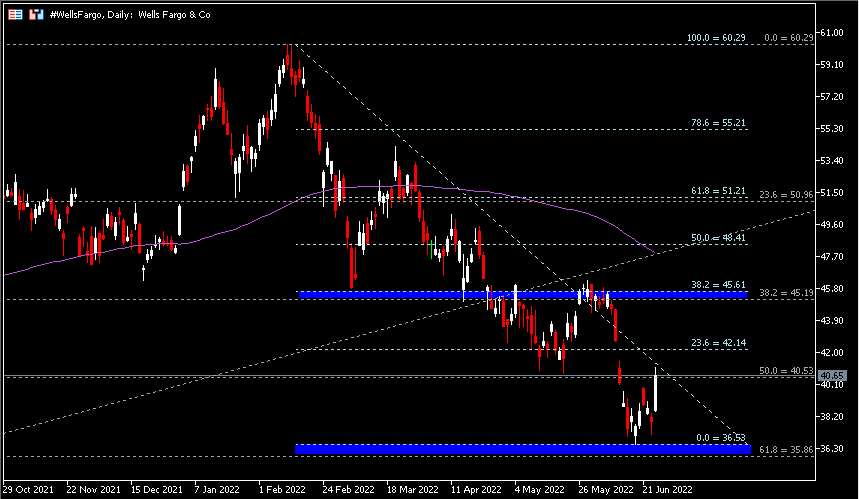
The Daily chart displayed #WellsFargo rebounded higher after gaining its foot above $35.86 – $36.53. In a bigger picture, the bank’s stock price remains traded in a bearish trend. To further clarify technical correction, it must break the nearest resistance at $40.53, followed by minor resistance at $42.14 and the $45.19-$45.61 resistance zone. The 100-day SMA serves as an important indicator in which a strong bullish break (sustain and without a strong retrace afterward) above it may indicate a change in medium-long term direction. On the other hand, if bullish breakout unsuccessful, the downward trend may resume towards testing support $35.86-$38.53, followed by psychological level $34.00 and $29.22.
Click here to access our Economic Calendar
Larince Zhang
Market Analyst
Disclaimer: This material is provided as a general marketing communication for information purposes only and does not constitute an independent investment research. Nothing in this communication contains, or should be considered as containing, an investment advice or an investment recommendation or a solicitation for the purpose of buying or selling of any financial instrument. All information provided is gathered from reputable sources and any information containing an indication of past performance is not a guarantee or reliable indicator of future performance. Users acknowledge that any investment in Leveraged Products is characterized by a certain degree of uncertainty and that any investment of this nature involves a high level of risk for which the users are solely responsible and liable. We assume no liability for any loss arising from any investment made based on the information provided in this communication. This communication must not be reproduced or further distributed without our prior written permission.


