


GOOGLE and AMAZON
On Wall Street, the USA500 closed 3.1% for the worse, and the tech-laden USA100 with a 4.6% loss. Corporate earnings and guidance have been flagging the nascent signs of a deteriorating business environment and outlook risks. As investors are losing their faith in stock market, the pressure has moved to today’s earnings reports, as two of the industry leaders Amazon and Google parent, Alphabet, will release their earnings reports for the fiscal quarter ending Sep 2018, after today’s closing bell on Wall Street.
Alphabet (Google)
Alphabet Inc. is a holding company and Google’s parent company. The company’s businesses include Google Inc. (which is the largest one) and its Internet products, such as Access, Calico, CapitalG, GV, Nest, Verily, Waymo and X. The company’s segments include Google and Other Bets.
Alphabet’s third quarter earnings for 2018 will be reported after the US Market close today. The consensus recommendation for the company is “strong buy”, corresponding to the majority of the consensus recommendation for the Online Services peer group, as 23 out of 29 analyst firms recommend “buy” or “Strong buy” and 2 suggest remaining on hold, while just 4 analyst firms propose the “Buy” possibility. Hence, no analyst firm is making a “Sell” or “underperform” recommendation for the company.
According to Zacks Investment Research, the information service is expected to have $10.43 in earnings per share during the third quarter of 2018, which represents a yearly change of 8.7%, since the reported EPS for the fiscal quarter ending September 2017 was $9.57. Focus should also turn on revenues number which is projected to hit 22.6% yoy rise, to around $34.04 billion, from the $27.77 billion reported last year.
Alphabet has faced some serious difficulties during the 2nd quarter, as EU Commission accused the company for anticompetitive methods regarding its mobile search engine. The company was fined 5.1 billion by the EU, which it managed to handle but it also proceed in an appeal despite the fact that it already took the charge. Despite the pressure during the 2nd quarter, the search giant’s quarterly profits are expected to continue rising over the next five years. The earnings are expected to grow at an average annual rate of 17.37%, with the current year projection for EPS reaching 22.80%.
However, worries regarding another government intervention still hold. This in combination with the sharp decline we have seen in tech stocks over the last 3 months, raise concerns whether the company’s earnings will manage to reach consensus.
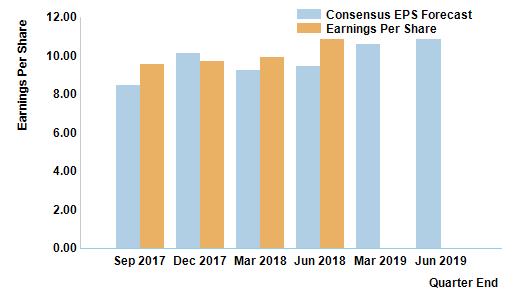
Figure 1: [Nasdaq (2018)] Reprinted from Alphabet Inc. Analyst Forecasts Earnings Growth, retrieved from https://www.nasdaq.com/quotes/.
At this stage, we have to point out that, the consensus recommendation, similarly to economic data forecasts, has a significant effect on the near-term stock price, as it represents a company’s wealth picture. Hence on every earning report, stock price is highly influenced by the comparison between the outcome and the expectations. The market tends to react positively if the outcome comes better or at least in line with the forecast, while the price moves lower if the reported earnings miss expectations.
Since September 2017, the company’s earnings missed expectations only once and positively surprised three times. Despite the missed earnings expectations, Google stock price was seen continuously increasing until it reached the $1,272.36 high in July 1. The 4-year incline was affected by the increase of sales estimates and the general constant growth of Alphabet Inc.
The fall however, since the earnings report release for the fiscal quarter ending June 2018 was driven by the miss on earnings, the EU fine and global tech sell-off. The sell-off still holds sharply, as concerns that earnings momentum is levelling off and that tighter financial conditions, coupled with ongoing trade tensions hitting the global growth outlook, are prompting investors to rethink lofty equity valuations.
These caused the price to drop by nearly $222.00, to the $1051.53 level since July’s peak.
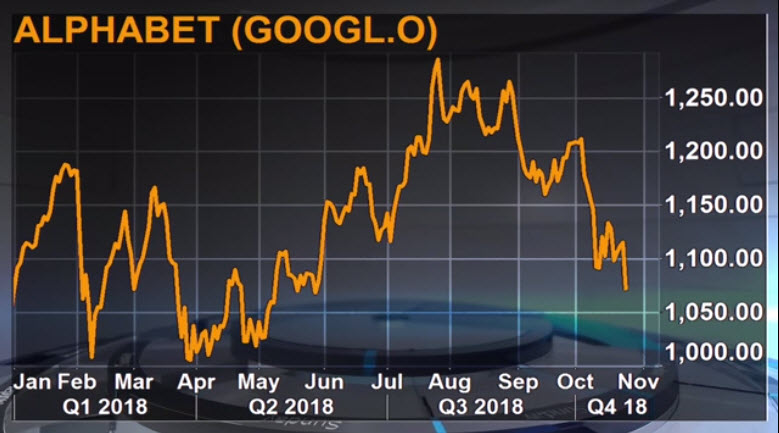
Figure 2: [Thomson Reuters (2018)]
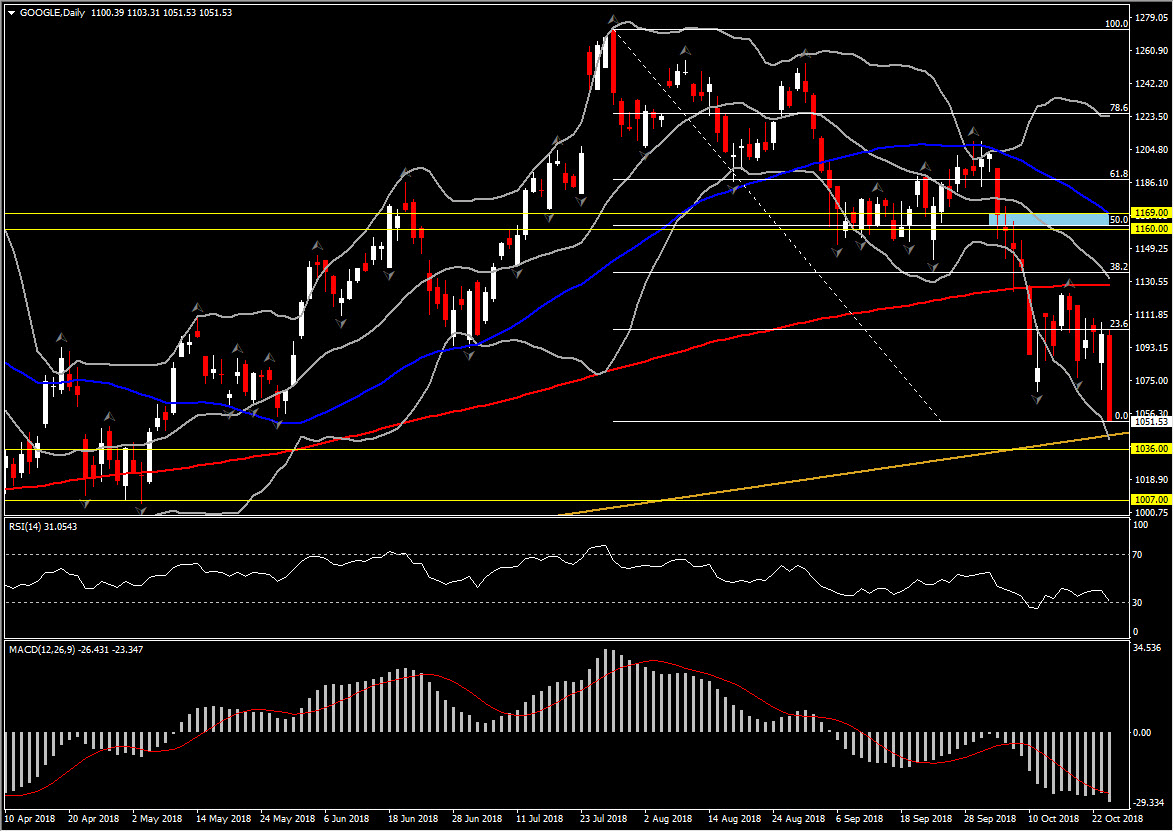
After the sharp drop by 17.16% down, the past 3 months, a decisive turn above $1,160.00 – $1,169.00 area, could turn the attention to the northwards again. This area is significant as it coincides with 50% return of the losses seen since July, with the 50-day SMA and 20-week SMA. Hence, if price action manages to sustain a move above this area, is likely to turn towards $1,230.00 (61.8% Fib. level). A move higher could take the asset towards the 100% Fibonacci extension at the $1,330.00.
For now, the sell-off sentiment continues to push stock price lower, just a breath away from the ascending trend-line set since the June 2015 low and seems to fully support the asset since then. The trend-line coincides with the 20-month SMA, at $1,036.00 which provides the immediate Support level for the asset. An extension lower could be supported by April’s low at $1,007.00.
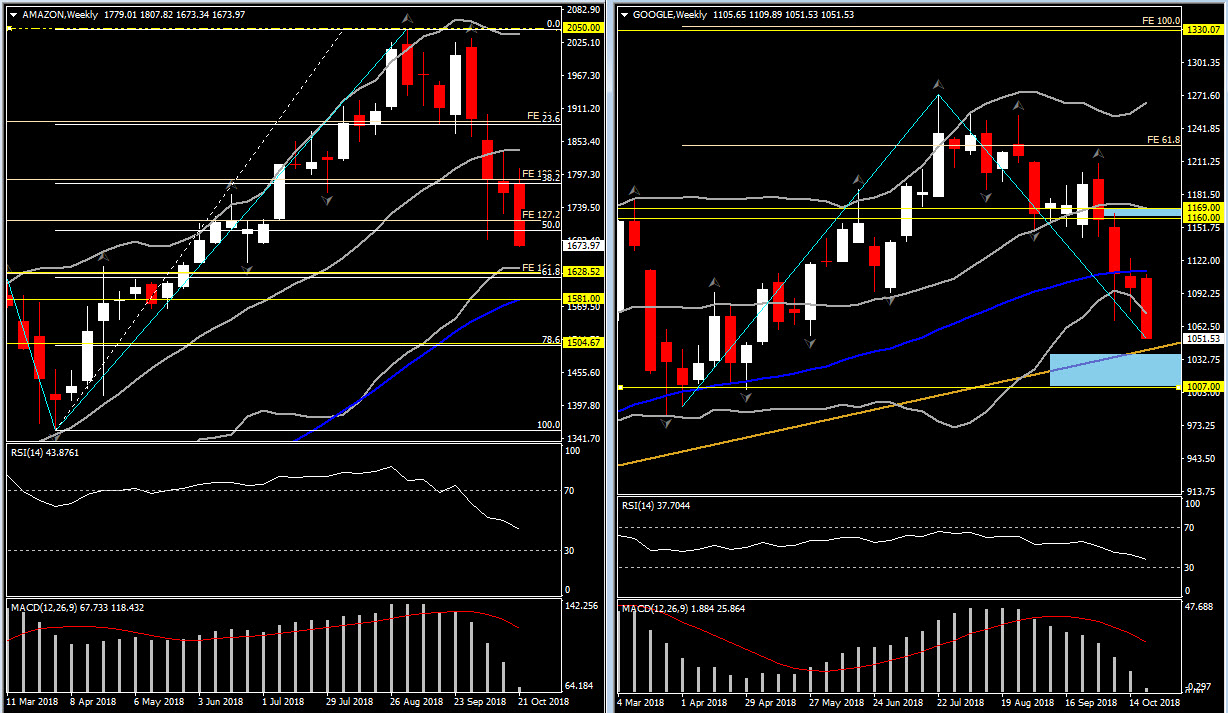
Technically, the medium-term outlook for the corporation’s shares remains strongly bearish, with trading activity taking place below all daily MAs and below 20- and 50-week MAs, while momentum indicators comply with this as well. Weekly RSI is at 37 and falling, suggesting that there is further space to the downside. MACD lines are at neutral zone below signal line.
Amazon:
The consensus recommendation for the company is “Strong buy”, which matches the majority consensus recommendation for the Software peer group (29/33). Amazon is expected to post $3.29 earnings per share and a revenue of $57.0 billion, which reflect a huge increase of more than 500% on earnings and a 30.2% grow on revenue on a year-over-year basis. According to Refinitiv, Amazon is expected by analysts to report a September-quarter non-GAAP net profit of $1.54 billion, compared to just $256 million a year ago.
The company’s earnings robustly beat expectations in the last 4 quarters and it is expected to do it today as well, despite the 12% fall seen this month. There is nearly nothing to point conversely, as the 3rd quarter was a good one for Amazon, as it managed to join Apple into the $1 trillion market value club. During 3rd quarter, the company will also include one of its largest shopping events, the Prime Day, which is expected to boost the quarterly revenue along with its subscription number.
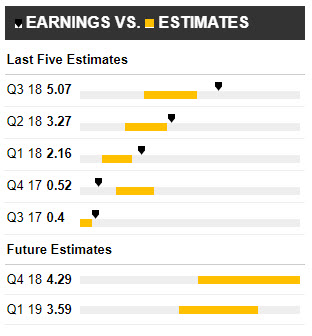
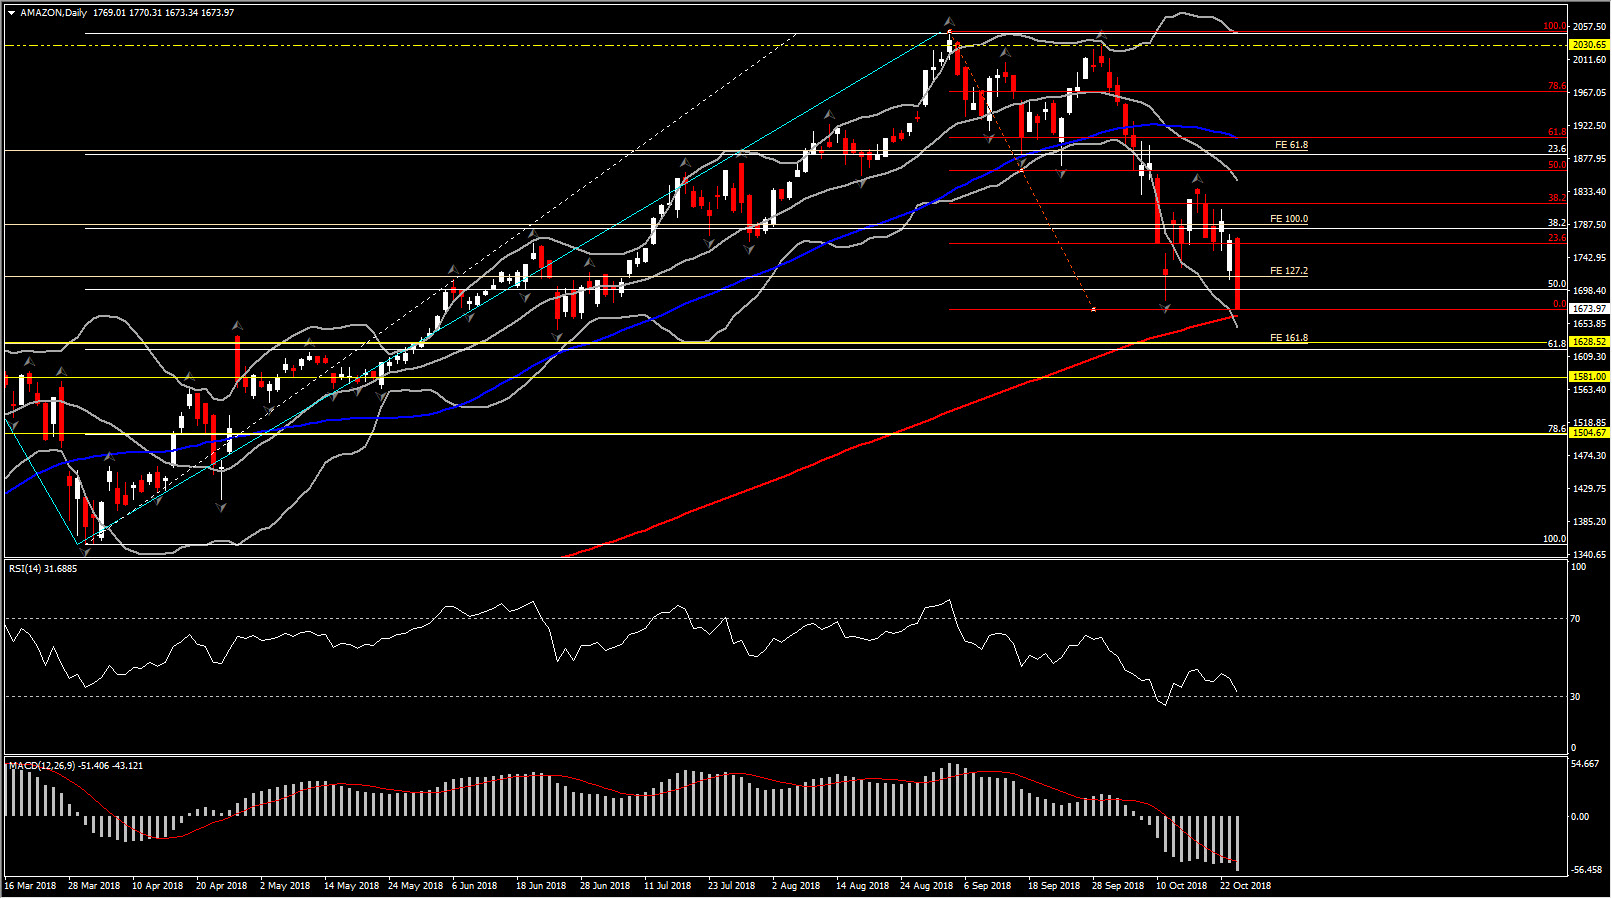
Figure 13: [Thomson Reuters(2018)] Reprinted from Amazon.com Inc. Financial, retrieved from https://www.reuters.com/finance/stocks/overview/AMZN.OQ
Despite estimates which expect the giant’s earnings to post another massive growth report, the fall by 18.37% seen since $2,050.00 push Amazon’s stock price further to the downside.
Taking a technical look at Amazon’s stock, the drop of daily RSI and the increase of MACD oscillator further to the downside is pointing to a bearish medium term picture. In the medium-term, the asset crossed below 20-week SMA 3 weeks ago, while it is moving below 20- and 50-day SMA and just $9 above 200-day SMA. The price movement suggests further bias towards bearish. Therefore the extension lower for Amazon price, prior to the earnings announcement or even disappointing earnings outcome, could find immediate Support at the $1,618.00 – $1,628.00 area, which is between the 61.8% Fib. level and the 61.8% fib. extension set since April’s bottom.
A breaking through this area however is crucial as it is a “free fall” from that level downwards. Support could possibly occur around 50-week SMA, at the $1,581.00, and the $1.504.60, which coincides with the 78.6% Fibonacci level of the rally from $1,358.00 low.
Conversely, immediate Resistance to a falling stock on the back of a rebound, could occur around the latest up fractal. The latest daily up fractal coincides with the mid of 2-month decline, at $1,860.00. A move above the latter is likely to restore the bullish outlook, with the shares eyeing at record high, at $2,050.00 again.
Click here to access the HotForex Economic calendar.
Want to learn to trade and analyse the markets? Join our webinars and get analysis and trading ideas combined with better understanding on how markets work. Click HERE to register for FREE! The next webinar will start in:
[ujicountdown id=”Next Webinar” expire=”2018/10/30 14:00″ hide=”true” url=”” subscr=”” recurring=”” rectype=”second” repeats=””]
Andria Pichidi
Market Analyst
HotForex
Disclaimer: This material is provided as a general marketing communication for information purposes only and does not constitute an independent investment research. Nothing in this communication contains, or should be considered as containing, an investment advice or an investment recommendation or a solicitation for the purpose of buying or selling of any financial instrument. All information provided is gathered from reputable sources and any information containing an indication of past performance is not a guarantee or reliable indicator of future performance. Users acknowledge that any investment in FX and CFDs products is characterized by a certain degree of uncertainty and that any investment of this nature involves a high level of risk for which the users are solely responsible and liable. We assume no liability for any loss arising from any investment made based on the information provided in this communication. This communication must not be reproduced or further distributed without our prior written permission.


