


EURJPY, H1 and Daily
European stock markets are moving higher, with GER30 outperforming. The GER30 boosted by strong German orders data at the start of the session and equity markets are shrugging off the prospect of a rate hike next year coming somewhat earlier than markets currently price in. Meanwhile, EURUSD ran into a wall of selling above 1.1700, managing to post a 7-session high of 1.1720 before correcting to levels around 1.1680. The pair still remains up by 0.2% on the day, and by 1% over the last week.
EURJPY and other Euro crosses are also buoyant. EURJPY is up 0.4% on the day and by 1.1% on the week-on-week comparison. A run of good data out of the Eurozone has underpinned the common currency. German Manufacturing orders were much stronger than expected with growth of 2.6% m/m. Yesterday saw unexpected upward revisions to final Eurozone June Services and composite PMIs.
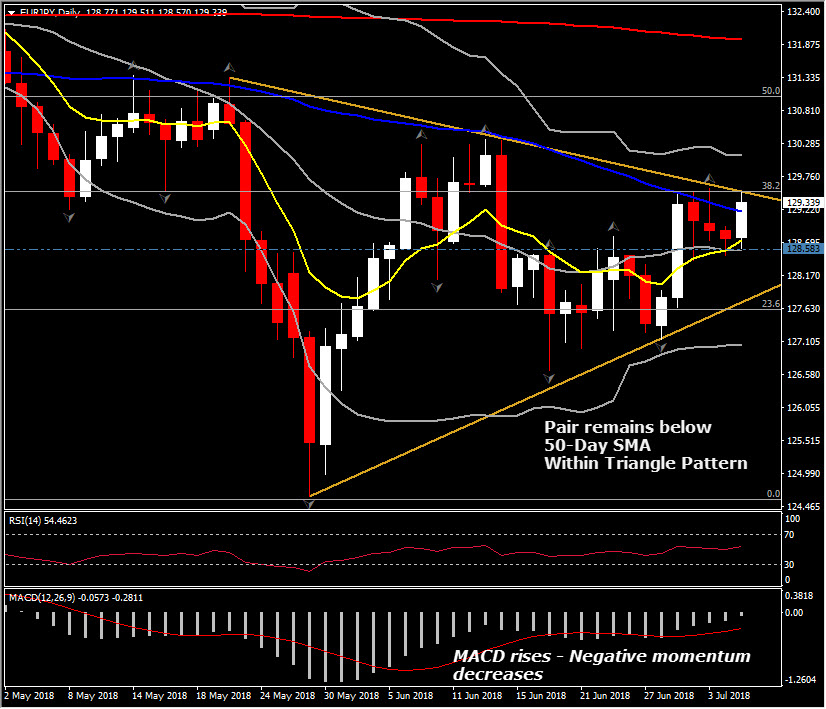
EURJPY is currently trading for the fourth consecutive day a breath away from 38.2% Fibonacci retracement level of the drift from 137.50 to 124.60. Also, the pair is moving within a triangle since end of May, while it is currently trading at the up edge of the sloping upper line. A triangle, formed by lower highs and higher lows, represents a bearish pattern for an asset.
From a technical point of view, the pair in the long term is negative to neutral as RSI lifted to 50 and MACD oscillator is rising in the negative territory with strong momentum, indicating a further upside reversal is nearing. Support comes at the 20-Day MA, at 128.50. Resistance holds at the confluence of triangle’s upper line, 38.2% Fib. Level and latest daily up fractal at 129.50. Hence only a breakout above the triangle’s upper line (coincides with 38.2% Fib. level) could increase the positive bias for the pair and could retest the 50% Fib. level. Whereas a break of the long term Support opens the way towards 23.6% Fibonacci level at 127.50.
In the short term, the intraday momentum indicators turned from neutral to positive after the sharp spike seen prior London open. Specifically, in the 1-hour chart RSI ticked up 26 points to 66 and it holds above 66 since then, while MACD crossed in the positive area and well above its trigger line. More of the same could be seen in the 4-hour chart as well.
On the upside, EURJPY should keep today 50% or more of day’s gains. Therefore it needs to sustain price action above R1-R2 at 129.00-129.20 area. On the downside, a decline below R1 could meet the PP level at 128.75 and could also retest the 200-period EMA in the 1-hour chart, which overlaps with the 128.50 support.
In the bigger picture, last week’s agreement among EU members on immigration (to shore up external borders and create screening centres for migrants), along with Merkel’s compromise on border controls, to preserve the governing coalition in Germany, have reduced the existential-threat discount that had been built into the Euro, on the view that this should placate the Italian populist government and broader Eurosceptic, populist movements across the region.
A major “known unknown” is to how deep and how prolonged the Trump-led trade war with major economies will be, and what economic and currency market fallout this will cause, and this keeping directional commitment at bay for now.
Click here to access the HotForex Economic calendar.
Want to learn to trade and analyse the markets? Join our webinars and get analysis and trading ideas combined with better understanding on how markets work. Click HERE to register for FREE! The next webinar will start in:
[ujicountdown id=”Next Webinar” expire=”2018/07/05 15:00″ hide=”true” url=”” subscr=”” recurring=”” rectype=”second” repeats=””]
Andria Pichidi
Market Analyst
HotForex
Disclaimer: This material is provided as a general marketing communication for information purposes only and does not constitute an independent investment research. Nothing in this communication contains, or should be considered as containing, an investment advice or an investment recommendation or a solicitation for the purpose of buying or selling of any financial instrument. All information provided is gathered from reputable sources and any information containing an indication of past performance is not a guarantee or reliable indicator of future performance. Users acknowledge that any investment in FX and CFDs products is characterized by a certain degree of uncertainty and that any investment of this nature involves a high level of risk for which the users are solely responsible and liable. We assume no liability for any loss arising from any investment made based on the information provided in this communication. This communication must not be reproduced or further distributed without our prior written permission.


