


USA30, Daily
It is an interesting time for global stock markets with Trade Wars and a strong USD hanging over future direction.
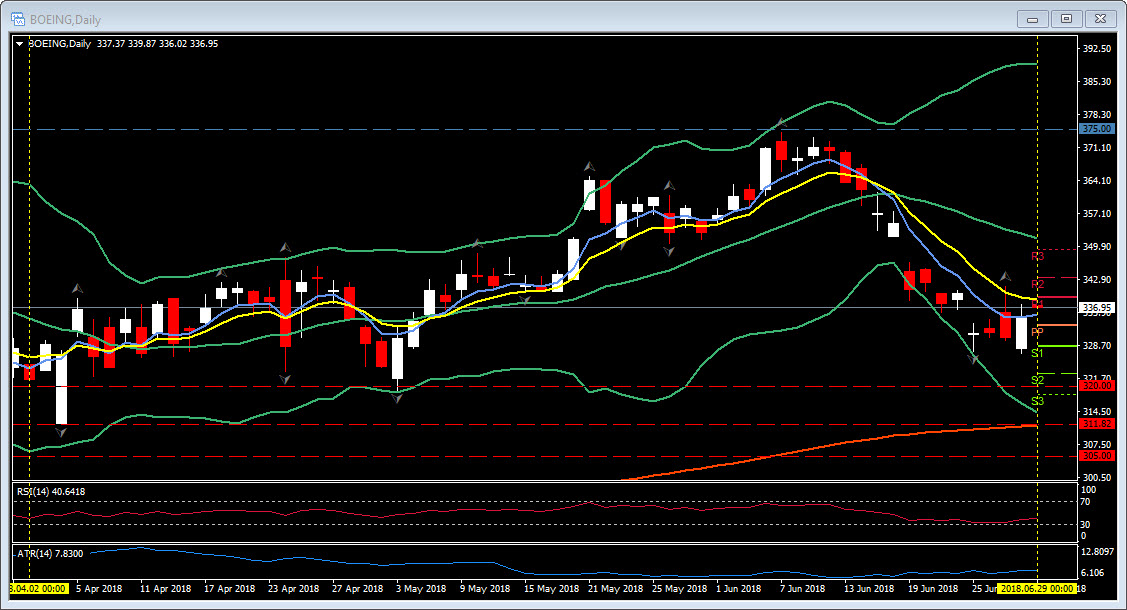
The key USA30 closed up (o.26%) on Friday, but down for the third week in a row (last time it did that was back in 2016) and closed the month some 0.59% lower but closed the quarter just 0.7% higher. Mixed messages indeed and a return of volatility. The industrial-heavy USA30 is suffering, particularly because of the trade frictions and companies like Boeing having had a torrid few months losing some 13% of its value during June, having rallied up 12 % during May. The wider USA500 and tech- heavy USA100 performed significantly better than the USA30, rising 2.94% and 6.33% respectively during Q2.
The USA30 dropped to its 200 day moving average three significant times during Q2 as we closed out each month, rallying during the month only to fall towards month end. However, as the trade dispute continues to escalate and no side looking to back down, the USA30 remains bearish and a break of 24,000 and the 200 day moving average that has proved strong support so far this year could see further declines.
First support is around 23,970 (Daily S2), 23, 835 (50 period moving average and Daily S3) and 23,435 (lower weekly Bollinger Band and next Fractal low) above the psychological 23,000. RSI (35 and falling ) and MACD (broke under 0 line last Monday and turned significantly lower) are both trending lower too. To the upside the strong support at 24,000 needs to hold and support a rally that would need to breach 24,800 (daily 20 day moving average and R3) if the USA30 is to move forward once again.
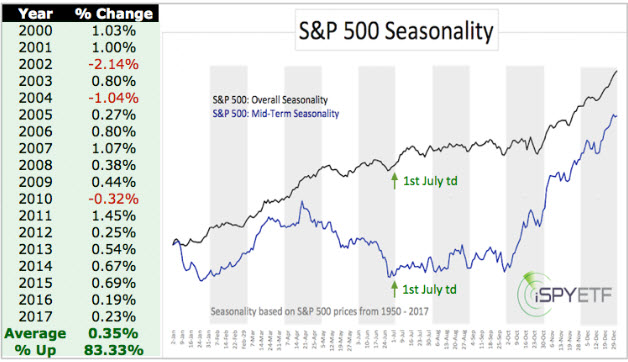
Today, July 2, can be a strong day for US markets. Simon Maierhofer of the iSPYETF and Jeff Hirsch of the Stock Market Almanac both report on the first trading day of July. Maierhofer suggests an 83.33% chance of an up day today for the S&P 500 over the last seventeen years, but tempers that with weakness in mid-term years (2018 is a mid-term year). Mairhofer’s chart below shows the seasonality for the S&P 500 for the last sixty-seven years (1950-2017).
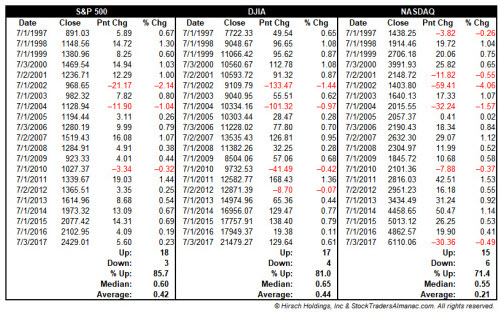
The more widely read Stock Market Almanac reports that “July’s first trading day is the second best performing first trading day of all twelve months. S&P 500 has advanced 85.7% of the time (average gain 0.42%). No other day of the year exhibits this amount of across-the-board strength which makes a solid case for declaring the first trading day of July the most bullish day of the year over the past 21 years”.
The close of the markets tonight will show if the first trading day of Q3 2018 (with all its rhetoric surrounding the trade issues) bucks the trend and posts a decline or adds to the trend and closes in positive territory for the day.
Click here to access the HotForex Economic calendar.
Want to learn to trade and analyse the markets? Join our webinars and get analysis and trading ideas combined with better understanding on how markets work. Click HERE to register for FREE! The next webinar will start in:
[ujicountdown id=”Next Webinar” expire=”2018/07/03 14:00″ hide=”true” url=”” subscr=”” recurring=”” rectype=”second” repeats=””]
Stuart Cowell
Senior Market Analyst
HotForex
Disclaimer: This material is provided as a general marketing communication for information purposes only and does not constitute an independent investment research. Nothing in this communication contains, or should be considered as containing, an investment advice or an investment recommendation or a solicitation for the purpose of buying or selling of any financial instrument. All information provided is gathered from reputable sources and any information containing an indication of past performance is not a guarantee or reliable indicator of future performance. Users acknowledge that any investment in FX and CFDs products is characterized by a certain degree of uncertainty and that any investment of this nature involves a high level of risk for which the users are solely responsible and liable. We assume no liability for any loss arising from any investment made based on the information provided in this communication. This communication must not be reproduced or further distributed without our prior written permission.


