


USA500, H1
US equities succumbed to the downtrend again after a heavy session on global bourses overnight took its toll, with weakness again evident in Asia after a 1% fall on China’s CSI300, though the Nikkei was flat and the HK Hang Seng 0.5% firmer. Europe is defensive as well, with the GER30 -1.1% and UK100 outperforming at -0.2%. US Q1 GDP was revised lower to 2.0% from 2.2%, while jobless claims popped 9k higher to 227k.
US futures are rolling over again in pre-market trade, as the Dow sinks 121-points and USA500 caves 8-points ahead of the open. There had been some optimism overnight on US futures after Marvell Technology +12% surged on regulatory approval by China for its $6 bln bid for Cavium. The dollar index is 0.12% lower near 95.15 after yesterday’s surge. Fedspeak from doves Bullard and Bostic is due, along with the $30 bln 7-year auction results.
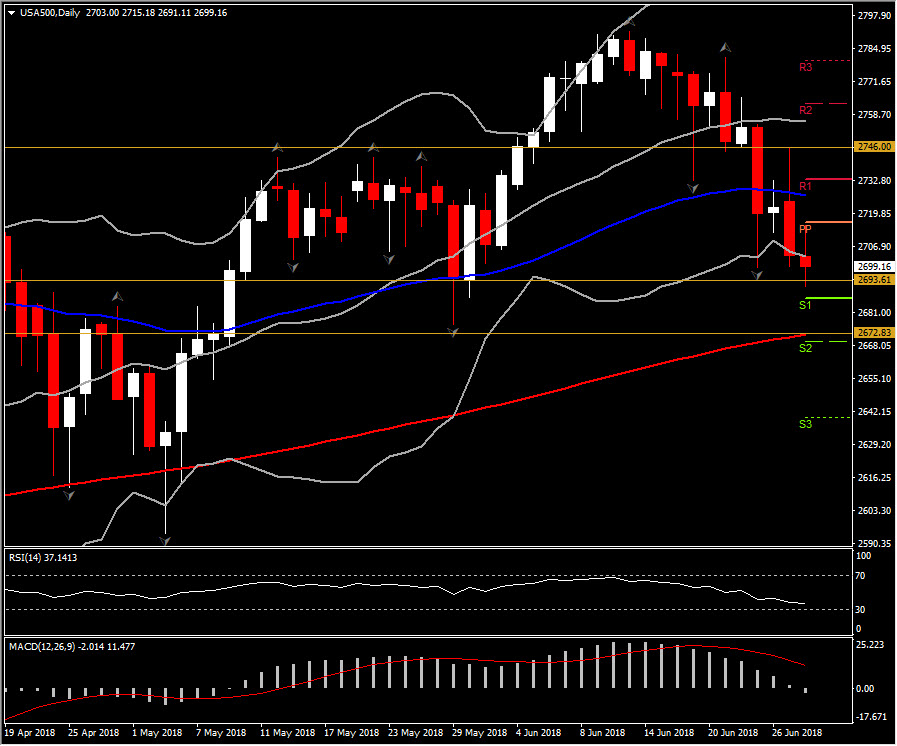
Yesterday, I wrote for USA500 that: “Significantly, USA500 Futures are showing modest gains since yesterday, while today the asset is looking ready to form a Morning Star pattern, as it rebounded up to the confluence of R2 from PP Analysis and the 50% Retracement level since June 13, at 2743.00.The Morning Start formation could be confirmed if today’s closing covers the majority of Monday’s strong bearish candle. “
The Morning Star formation never confirmed since USA500 has reversed since yesterday’s post. The Index posted a Close Price outside the lower Bollinger Bands pattern at 2703.48. This along with the fact that USA500 is trading for a 2nd consecutive session below 50-DAY MA indicate that the momentum is strongly negatively configured. Support remains at the latest low fractal at 2693.60. A breakout of this neckline will imply the confirmation of a Rounding Top pattern. A break below Rounding Top neckline signals further downwards movement. Next long-term Support comes at 200-Day MA, at 2672.80. If the asset fails to break below the neckline, then Support could react as a retracement level.
Currently in the 1-hour chart, the USA500 has rebounded on US Open. It remains weak however, as it is trading within the low Bollinger Band pattern with momentum indicators holding in the negative territory. The RSI holds below 50, while MACD oscillator increases to the downside above signal line. Both indicators propose that there is further steam to the downside for today.
Intraday, only a break above the confluence of the 50-period EMA, PP level and today’s peak at 2715.00 could suggest a retest of R1 at 2735.00.
Daily Chart:
Click here to access the HotForex Economic calendar.
Want to learn to trade and analyse the markets? Join our webinars and get analysis and trading ideas combined with better understanding on how markets work. Click HERE to register for FREE! The next webinar will start in:
[ujicountdown id=”Next Webinar” expire=”2018/07/03 14:00″ hide=”true” url=”” subscr=”” recurring=”” rectype=”second” repeats=””]
Andria Pichidi
Market Analyst
HotForex
Disclaimer: This material is provided as a general marketing communication for information purposes only and does not constitute an independent investment research. Nothing in this communication contains, or should be considered as containing, an investment advice or an investment recommendation or a solicitation for the purpose of buying or selling of any financial instrument. All information provided is gathered from reputable sources and any information containing an indication of past performance is not a guarantee or reliable indicator of future performance. Users acknowledge that any investment in FX and CFDs products is characterized by a certain degree of uncertainty and that any investment of this nature involves a high level of risk for which the users are solely responsible and liable. We assume no liability for any loss arising from any investment made based on the information provided in this communication. This communication must not be reproduced or further distributed without our prior written permission.


