


USA500, Daily
US equities revived from pre-market lows after the Trump team provided more specifics on CFIUS legislation, which was taken as a positive step by the markets to counter tech transfer and IP theft. Yet the trade crisis continues to cast a pall over the markets, with Chinese indices in bear market territory and the threat of further retaliation.
Shares in Asia slumped with the JPN225 -0.3%, though Europe perked up with gains on the UK100 +0.9% and GER30 +1%. Stateside the USA30 is 28 points firmer and USA500 is up 4 points, well up from trading in the red overnight. Durable Goods orders dipped less than expected and the advanced indicators trade gap narrowed. The US Durables report beat estimates mostly via big upward April revisions for ex-transportation, defence, and ex-air capital goods orders, followed by upside May surprises via a big 15.8% defence orders surge, a smaller than expected 1.0% transportation orders hit, and a firm 0.3% May inventory rise.
China is mulling further retaliation even as it continues to guide the Yuan weaker and is reportedly considering curtailing Treasury purchases.
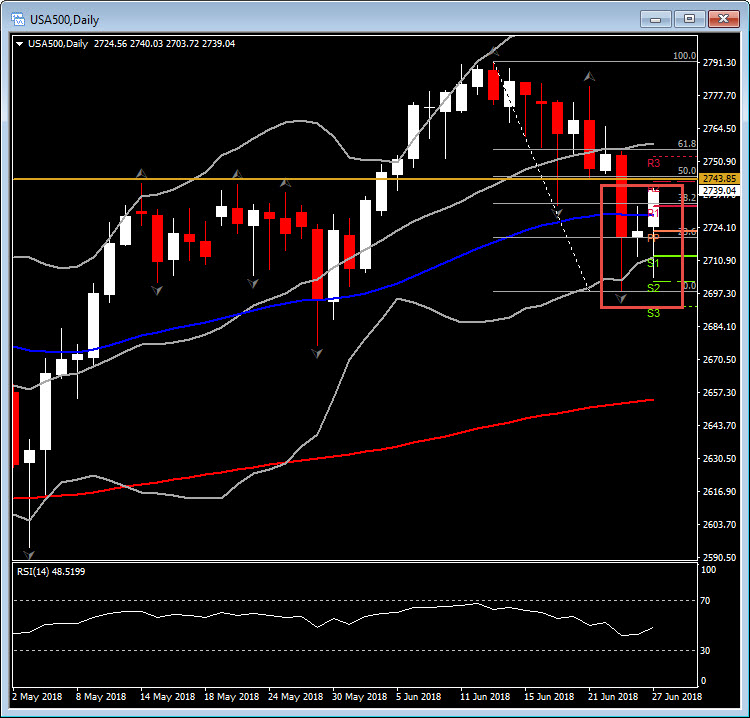
Technically-wise USA500 is trading in a longterm upchannel since April, however 95 points correction move to the downwards has been identified since June 13. As trade angst remains prominent and weighs on equities, the USA500 drift down to 2768.00 level. Significantly, USA500 futures are showing modest gains since yesterday, while today the asset is looking ready to form a Morning Star pattern, as it rebounded up to the confluence of R2 from PP Analysis and the 50% Retracement level since June 13, at 2743.00.The morning start formation could be confirmed if today’s closing covers the majority of Monday’s strong Bearish candle.
The asset is currently trading within the Daily lower Bollinger Bands pattern and above 50 and 200-Day MA. The overall picture of the USA 500 suggests that if the asset holds above Resistance area at 2743.00 – 2746.00, then it is likely to retest the next strong resistance level at 20-DAY MA. The Resistance at 2743.00 could be considered as extremely strong as it coincides with the latest 3 consecutive up fractals in May.
The momentum indicators present a mixed picture. The Daily RSI is sloping positively at 49, MACD oscillator decreases below its signal line, and Stochastic is pointing lower.
Click here to access the HotForex Economic calendar.
Want to learn to trade and analyse the markets? Join our webinars and get analysis and trading ideas combined with better understanding on how markets work. Click HERE to register for FREE! The next webinar will start in:
[ujicountdown id=”Next Webinar” expire=”2018/06/28 15:00″ hide=”true” url=”” subscr=”” recurring=”” rectype=”second” repeats=””]
Andria Pichidi
Market Analyst
HotForex
Disclaimer: This material is provided as a general marketing communication for information purposes only and does not constitute an independent investment research. Nothing in this communication contains, or should be considered as containing, an investment advice or an investment recommendation or a solicitation for the purpose of buying or selling of any financial instrument. All information provided is gathered from reputable sources and any information containing an indication of past performance is not a guarantee or reliable indicator of future performance. Users acknowledge that any investment in FX and CFDs products is characterized by a certain degree of uncertainty and that any investment of this nature involves a high level of risk for which the users are solely responsible and liable. We assume no liability for any loss arising from any investment made based on the information provided in this communication. This communication must not be reproduced or further distributed without our prior written permission.


