


XAUUSD, Daily
As I wrote on Tuesday’s post, for Gold:“Next real Support for Gold comes at November’s low at the round $1,260.00 level, while the next Support will be at the confluence of December lows and 200-week SMA, at $1,236.00. Next Resistance is set at the peak of the day and latest up Fractal, at $1,284.00.The technical picture suggests further negative momentum despite the latest bullish hourly candle, as RSI is at the edge of the oversold area, MACD oscillator increases to the downside above its signal line and Volume remains high.”
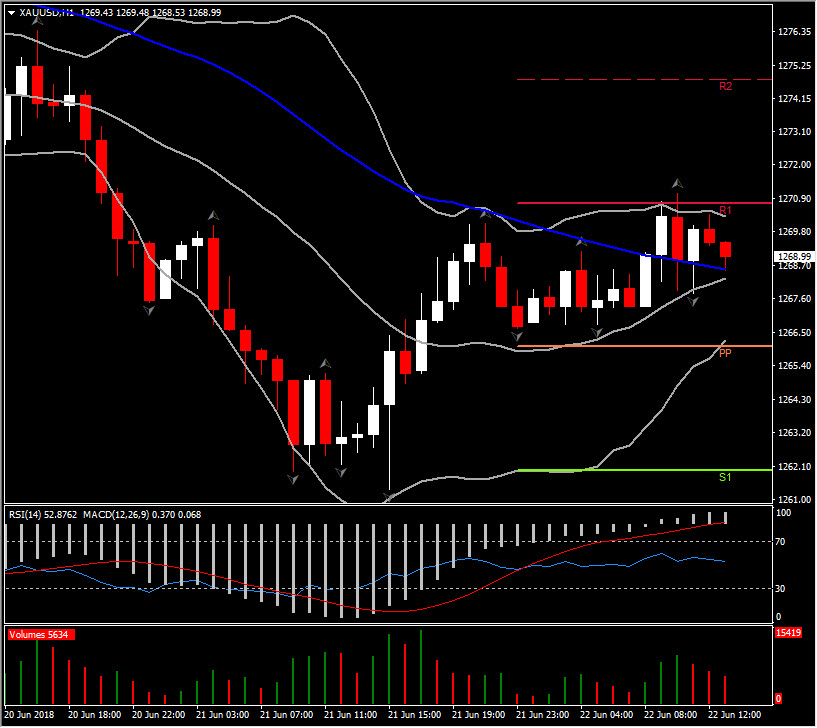
Indeed, Gold futures weakened further against the US Dollar since Tuesday, with yesterday’s lowest price reaching nearly a $1.00 above November’s low. The asset has been sharply driven by the bears for the last 5 consecutive days, with the daily candles formed below lower Bollinger Bands pattern, which is extended to the downside. Therefore, despite the small body bearish candle formed yesterday, the long lower shadow suggests that bears still have the major control of XAUUSD. The sellers are also gathering momentum once more with MACD oscillator accelerating lower below its signal line within the negative area. RSI is slightly below the 30 barrier, while Volume indicator is stable.
On the contrary, today XAUUSD has bounced from the six-month low of $1,263.20 seen earlier, up to $1,271.05 high. Even though today’s rebound along with the overextended momentum indicators might propose a possible trend reversal for the asset, the bearish bias remains strong. More precisely, the focus turns on the 50-day and 200-day MA for the development of a so-called “death cross” (i.e. the 50-day MA moves under the 200-day MA), which is taken as a bearish development. Currently, the 50-day MA is at $1,304.66, with the 200-day MA just over at $1,305.09.
Subsequently, the downwards momentum has not run out of steam yet, since we have not identified any significant reversal indication. However, the upwards intraday correction seen so far today could provide further trading opportunities. Next Support remains at $1,260.00, while the key Support level is at the 200-week SMA at $1,236.00. The reaction high at $1,280.00 is a key Resistance level which could trigger a swing higher up to $1,300.00.
Intraday Support levels: $1,270.00, $1,274.00, $1,279.00
Intraday Resistance levels: $1,266.00, $1,262.00, $1,252.00
Click here to access the HotForex Economic calendar.
Want to learn to trade and analyse the markets? Join our webinars and get analysis and trading ideas combined with better understanding on how markets work. Click HERE to register for FREE! The next webinar will start in:
[ujicountdown id=”Next Webinar” expire=”2018/06/26 14:00″ hide=”true” url=”” subscr=”” recurring=”” rectype=”second” repeats=””]
Andria Pichidi
Market Analyst
HotForex
Disclaimer: This material is provided as a general marketing communication for information purposes only and does not constitute an independent investment research. Nothing in this communication contains, or should be considered as containing, an investment advice or an investment recommendation or a solicitation for the purpose of buying or selling of any financial instrument. All information provided is gathered from reputable sources and any information containing an indication of past performance is not a guarantee or reliable indicator of future performance. Users acknowledge that any investment in FX and CFDs products is characterized by a certain degree of uncertainty and that any investment of this nature involves a high level of risk for which the users are solely responsible and liable. We assume no liability for any loss arising from any investment made based on the information provided in this communication. This communication must not be reproduced or further distributed without our prior written permission.


