


Bed Bath & Beyond, an American chain of domestic merchandise retail stores founded in 1971, got off to a good start this month. On March 7th, the company shares surged over 30% following activist billionaire investor Ryan Cohen buying nearly 10% of the company stake, with an intention to seek authority in nominating a new board directors to restructure the company’s operations.
The company share price has been hit hard since early 2021. The dissatisfying performance is attributed to several factors such as weakening fundamentals, supply chain issues, formidable competition, poor management, ineffective business strategies, disappointing quarterly earnings, traffic shift, etc.
In its latest earnings announcement, both earnings and sales of the company missed consensus expectations. Net loss has increased to -$276 million from -$75 million a year ago. Ongoing store closures may continue to hurt sales. Coupled with the headwinds above, the management has even slashed its outlook for the full year.
It will take time to see whether the business will get better under a new management team. It is worth noting that the company’s stock has become known as Meme stock. This may cause its share price to experience greater volatility over the short term, and make it difficult to value as a whole.
Meme stocks are stocks whose trading volume increases not necessarily because of a company’s performance, but because of social media attention which may result from a variety of factors unrelated to the company’s performance, financial position, or other business fundamentals.
Technical Analysis:
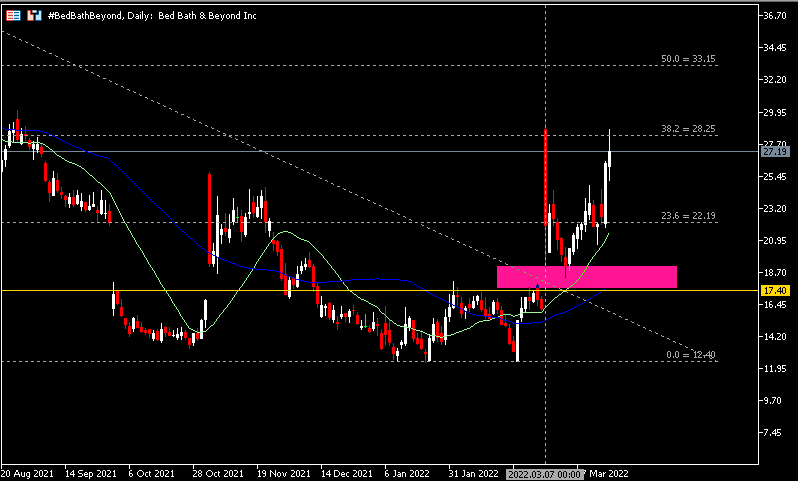
Technically, #BedBathBeyond remains supported above $22.20 (FR 23.6%) extended from the high point in Jan 2021 to the low point in Feb 2022. Both 20-day SMA (green) and 50-day SMA (blue) have formed a golden cross and extended higher. Upward price movement may be possible as long as the MA support remains unbroken. Nearest resistance to watch is $28.25 (FR 38.2%) and the intraday high formed on March 7th, $29.16, followed by $33.15 (FR 50.0%). The latter is a psychological price level that distinguishes the bullish and bearish zone. On the downside, if the price breaks below $22.20 and the 20-day SMA, $17.40-$18.80 may serve as a crucial support zone which also coincides with the 50-day SMA.
Click here to access our Economic Calendar
Larince Zhang
Disclaimer: This material is provided as a general marketing communication for information purposes only and does not constitute an independent investment research. Nothing in this communication contains, or should be considered as containing, an investment advice or an investment recommendation or a solicitation for the purpose of buying or selling of any financial instrument. All information provided is gathered from reputable sources and any information containing an indication of past performance is not a guarantee or reliable indicator of future performance. Users acknowledge that any investment in Leveraged Products is characterized by a certain degree of uncertainty and that any investment of this nature involves a high level of risk for which the users are solely responsible and liable. We assume no liability for any loss arising from any investment made based on the information provided in this communication. This communication must not be reproduced or further distribution.


