


The US banking behemoths – JPMorgan, Citigroup and Wells Fargo, are scheduled to release their Q4 earnings report on 14th January (Friday) before market open. Being among the top four banks (in addition to Bank of America) which account for 50% of all US banking assets, growth prospects remain positive in general which we will discuss in terms of macroeconomics and some of the core fundamentals of these financial service giants.
Overview:
Despite issues such as supply chain challenges, overheated inflation and Covid-19 uncertainties, the US economy remains firm. This benefits the banking sector, as it means fears of a protracted global recession are now off the table.. Prospects for pickup in growth following vaccines rollout, higher interest rates, improved loan growth and bank margins, increased card spending, heightened IPO activities, M&A frenzies, reversal on loan loss reserves, increase in shares buyback – these factors may be seen as favoring the banks in the near future.
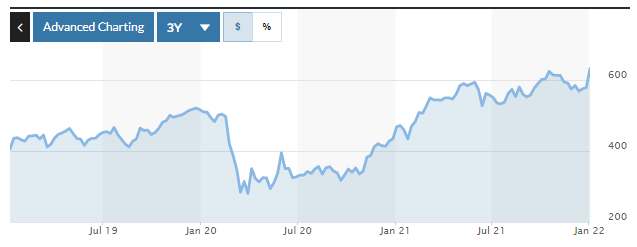
Figure 1: Dow Jones U.S. Banks Index. Source: MarketWatch
As of the latest data updated on 7th January, the Dow Jones US Banks Index hit record highs at 632.32, up 8.20% from the prior month and 35.03% from a year ago. The index has even outperformed the S&P 500, with the latter recording -0.74% from the prior month and only up 22.29% from a year ago. This shows that sentiment remains optimistic over the banking sector, while on the other hand, news that the Fed may raise rates soon could hurt the US stock market (which it priced in in December last year; though this is not always the case as the stock market has in fact experienced only two losing years since 1990 after the Fed took its hawkish move).
In short, while the current condition seems to benefit the banks, it is also worth taking into consideration the development of the Covid variant and effectiveness of current measures in tackling the situation. If vaccines continue to prove effective in preventing serious complications or death, a medical system breakdown or even major lockdown could be prevented, thus the negative impact on the economy and the banking sector could be minimized. Also, some other risk factors such as rises in unemployment rate, unexpected geopolitical events leading to recession, and a risk adverse environment for capital markets may put the banking sector under disadvantage.
摩根
JPMorgan
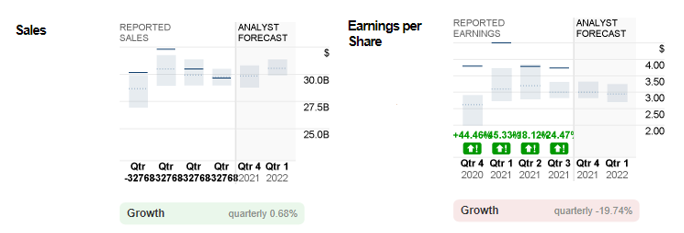
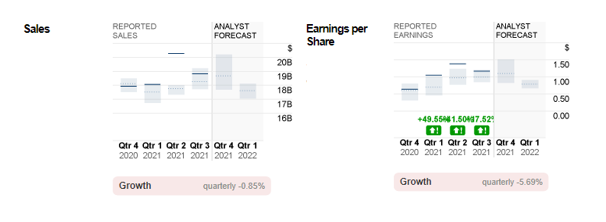
Figure 2: JPMorgan’s Quarterly Reported Sales and Earnings per Share. Source: CNN Business.
In the upcoming Q4 releases, consensus outlook remains mixed, in which sales revenue are expected to hit $29.8B, up 0.68% (q/q) and 0.23% (y/y). On the other hand, EPS is estimated to decline over 19% (q/q) and 20% (y/y) to $3.00.
Nevertheless, analyst consensus remains positive with a Buy rating held unchanged:
“We expect 4Q core results to be marked by a little better net interest income and strong investment banking, offsetting further normalization of trading and mortgage banking revenues and some further expense creep due to inflation and higher revenues” – Vivek Juneja, JPMorgan analyst.
Technical Analysis:
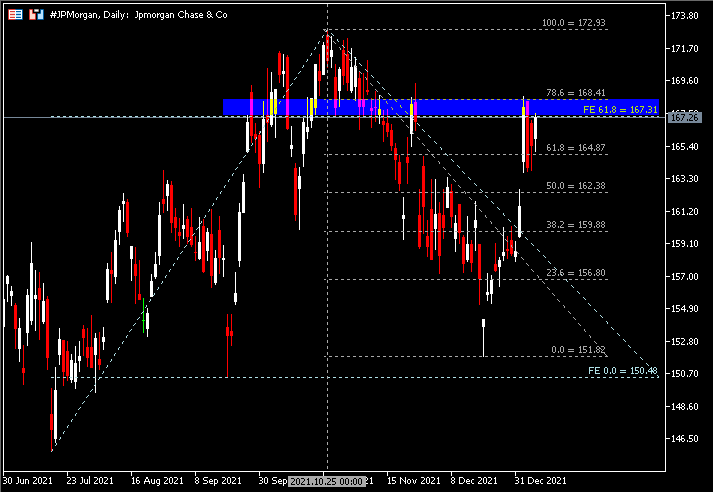
The #JPMorgan share price was in a bearish trend in the fourth quarter last year, leaving a peak at $172.93. The bank’s stock price then rebounded from the dip at $151.82 seen on 20th December, recouping more than 70% of the losses suffered in the quarter.
Latest price action shows that #JPMorgan remains well below the median estimate of analysts ($184) by 10%. It is currently testing the critical resistance zone $167.30-$168.40. A successful bullish breakout may suggest the bank’s share price will extend its gains towards the peak of Q4 2021, or $172.93. Otherwise, failing to break through the resistance zone may suggest the share price will undergo technical correction towards support $164.90 (FR 61.8%), $162.40 (FR 50.0%) and $159.90 (FR 38.2).
Citigroup
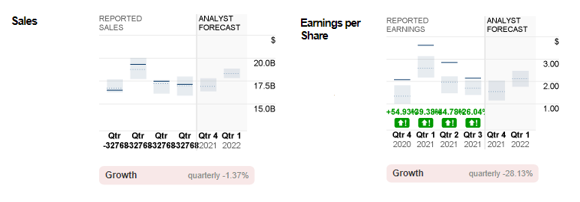
Consensus estimates for Citigroup’s reported sales stand at $16.9B, down 1.74% from the previous quarter but up 2.4% from a year prior. For EPS, it is expected to reduce by nearly 28% (q/q) and 25% (y/y) respectively to $1.55.
Despite the less than favourable forecast, sentiment remains positive with a “Buy” rating given on Citigroup’s business outlook and strong fundamentals. In the previous quarter, there was a total of $4 billion return to its shareholders in the form of common share repurchases and dividends; Net income improved 48% from a year ago; Revenues (excluding impact of the consumer sales business in Australia) were up 3% from the previous year; EPS rose 58% from the prior year period; Book value per share and tangible book value per share increased 9% and 10% respectively – these key metrics may imply that Citigroup remains in a position to deliver stable results in the near term.
Technical Analysis:

The Daily chart shows the #Citigroup share price rebounded from the lows of the year 2021 upon completion of an ABCD pattern. Since its fall from the highs at $80.28, the bank’s stock price has recouped 36% of the losses. $66.25 (FR 38.2%) serves as the nearest resistance to watch, followed by 100-SMA. Breaking above these levels may suggest #Citigroup will extend its bullish momentum to test $68.95 (FR 61.8%), followed by $75.42 (FR 78.6%). On the other hand, if the breakout is unsuccessful, support levels to watch are $62.95 (FR 23.6%) and the end leg of ABCD $57.59.
Wells Fargo
For Wells Fargo, analysts’ forecast for sales revenue stand at $18.7B, down 0.53% from previous quarter, but up 4.47% from the same period in the previous year. EPS is expected at $1.10, recording a decline of nearly 6% from the previous quarter, but up 83% from the same period last year. In general, the market continues to have buy ratings on the banks, and Wells Fargo is no exception.
According to Zacks, Wells Fargo is expected to remain competitive among its peers based on reasons such as strong deposits base, solid liquidity, prudent expense management, normalizing credit quality, healthy balance sheet and credit ratings, as well as its impressive capital deployment plans.
Technical Analysis:

The Daily chart shows the #WellsFargo share price has been on a strong bullish ride since it found its support at $20.76 in late October 2020. The bank’s stock price continued extending its momentum north following the gap high closing above last year’s high ($52.56) on the second trading day of 2022. $55.55-$56.55 will be the nearest resistance zone to focus on. Breaking above this zone would suggest #WellsFargo will continue testing the psychological level $60, before the next resistance level at $61.30. Otherwise, failure to break above the resistance zone $55.55-$56.55 may suggest the share price will extend losses, towards last year’s high ($52.56) or FE 61.8% ($52.00), followed by $48.90 (FR 61.8%) and $46.25 (last December’s low).
Click here to view the economic calendar
Larince Zhang
Market Analyst
Disclaimer: This material is provided as a general marketing communication for information purposes only and does not constitute an independent investment research. Nothing in this communication contains, or should be considered as containing, an investment advice or an investment recommendation or a solicitation for the purpose of buying or selling of any financial instrument. All information provided is gathered from reputable sources and any information containing an indication of past performance is not a guarantee or reliable indicator of future performance. Users acknowledge that any investment in Leveraged Products is characterized by a certain degree of uncertainty and that any investment of this nature involves a high level of risk for which the users are solely responsible and liable. We assume no liability for any loss arising from any investment made based on the information provided in this communication. This communication must not be reproduced or further distributed without our prior written permission.


