USDMXN, H4
US initial jobless claims data rose 20,000 to 332,000 in the week ended Sept. 11, above expectations of 316K. The four-week moving average of initial claims fell -4k to 336k, the lowest since March 14, 2020. Continuing claims fell -187K to 2665K in the week ended September 4, the lowest since March 14, 2020. The four-week moving average of Initial claims fell -50K to 2808K, the lowest since March 21, 2020.
https://www.census.gov/retail/marts/www/marts_current.pdf
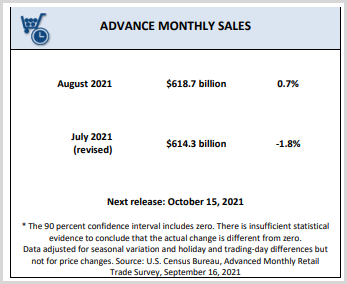
US retail sales rose 0.7% m/monthly to USD 618.7 billion in August, much better than expectations of a -0.7% decline. Ex-auto sales rose 1.80% m/m, versus expectations of a -0.1% decline. Ex-gasoline sales rose 0.8% m/m. Ex-auto, ex-gasoline rose 2.0% m/m. Total sales for the period June 2021 to August 2021 rose 16.3% from the same period last year.
Meanwhile, south of the USA, in last month’s final report the Mexican economy ekonomi grew 19,6% y/y in Q2 2021, the first increase in more than 2 years but slightly lower than the 19.6% in the initial forecast. However, it remains a record growth rate, as last year’s economy shrank at a record 18.7% pace due to the coronavirus lockdown. The secondary sector grew the most (27.9% vs. 28.2%), followed by services (17.1%, in line with the first estimate) and primary activity (6.7%, also in line with initial estimates). Meanwhile, Mexico’s annual inflation rate fell to 5.59% in August 2021 from 5.81% in July and almost in line with market expectations of 5.60%. It was the slowest rise in consumer prices since March, as the inflation rate weakened for the fourth month in a row towards the central bank’s 3% target range following two interest rate hikes. The annual core inflation rate, excluding volatile goods such as unprocessed food and energy, rose to a 9-month high of 4.78% in August, from 4.66% in the previous month. On a monthly basis, consumer prices edged up 0.19%, slowing from the 0.59% gain in July, slightly below the market forecast of a 0.20% increase.
USDMXN as of the time of writing is moving above the 19.9000 level and the pair has been showing a very tight price range for months, despite the occasional price burst on the upside. USDMXN also shows a very strong support level because the 19.5471 level. Traders expecting long trades may have walked away, leaving speculators who were comfortable taking advantage of short-term trades through fast positions in the price space of resistance and support levels.
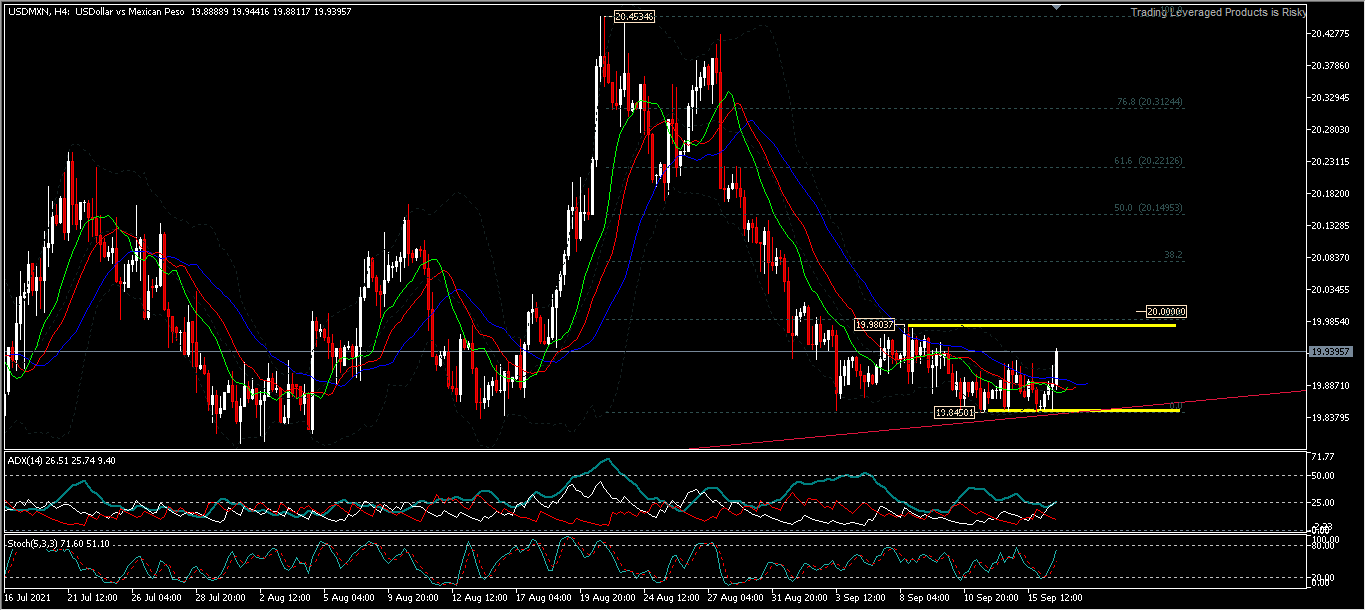
The intraday bias still presents a comfort zone for speculators who do not want to leave, because they still expect the pendulum to remain static for a longer time. Technically, the price space is between support 19.8450 and resistance 19.9803. A break of the resistance level 19.9803 entered the bulls’ minds with hopes of hitting the price higher near the neckline around 50.0% FR (+/-20.1500), but the bulls’ patience continues to be tested, and this has been going on for a long time. USDMXN has interestingly held below the 20.0000 mark since Sept. 3 fairly consistently.
The ability to stay below the key 20.0000 psychological mark may be a bearish signal, but the 19.8450 level remains a fairly strong support level that has proven to be durable over the long term. If the 19.8000 level is suddenly tested and a move occurs below the level, this may signal a significant bearish move is imminent. But if not, the bulls will flock to hit the barrier and the oscillation indicator game will stop and make room for the ADX to slide off and runway from the key 25.
Click here to access our Economic Calendar
Ady Phangestu
Market Analyst
Disclaimer: This material is provided as a general marketing communication for information purposes only and does not constitute an independent investment research. Nothing in this communication contains, or should be considered as containing, an investment advice or an investment recommendation or a solicitation for the purpose of buying or selling of any financial instrument. All information provided is gathered from reputable sources and any information containing an indication of past performance is not a guarantee or reliable indicator of future performance. Users acknowledge that any investment in Leveraged Products is characterized by a certain degree of uncertainty and that any investment of this nature involves a high level of risk for which the users are solely responsible and liable. We assume no liability for any loss arising from any investment made based on the information provided in this communication. This communication must not be reproduced or further distributed without our prior written permission.