US Elections have been and are always expected to be an extremely volatile event worldwide.. Elections, similar to other political or banking sector events, are notably treated by market participants with anticipation and speculation. As discussed in our HF Markets Q4 Outlook, markets look to have already pricing in the possibility of Biden’s victory even though they overall maintain an increasing cautious optimism, holding US Dollar basket to 2018 low territory.

Election-year fund flows, 1993-2020
Historically, it has been noticed that during election years, market participants due to the heightened uncertainty, shift their investments into money market funds instead of the safety of stock and bond funds, AS THEY waiting out. The year 2020 is not any different but it’s been a unique one as we have seen an extreme money flow into currency assets in comparison with past election years, due to the sluggish US and worldwide economic activity as the Covid-19 crisis resumes, the truce with China again which is under scrutiny, the lockdowns in several areas, the lack of additional fiscal stimulus from central bankers, Brexit frictions and the fear of double dip recession in Europe.

Year-to-date fund flows, through June 30
Source: BlackRock, with data from Morningstar as of June 30, 2020. Money market funds, stock funds and bond funds are represented by their respective US fund categories as defined by Morningstar.
That said, cash balance into money funds spike to $980 in 2020 as of June 30, given the large risk premia. However, as soon as uncertainty recedes we might see equity market’s volatility and volume to spike again since they are considered to be attractive and more stable assets in periods which there are historically low interest rates. If we emphasize on the medium term thought it is expected that if current conditions sustain, market volatility will extend beyond Election days with any potential outcome, i.e. a Biden win and Democrat majority in Congress, a Biden win but split Congress, or a Trump victory with split Congress.
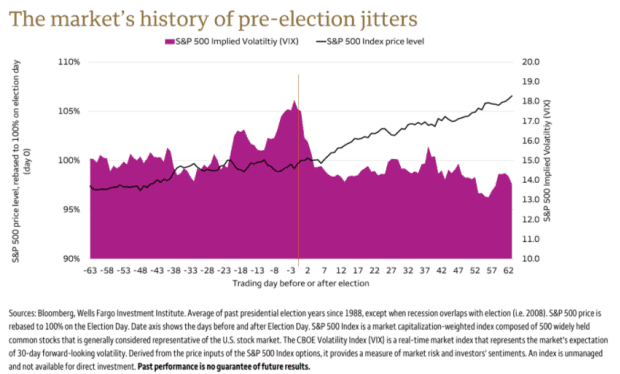
Meanwhile, a chart from Wells Fargo Investment Institute, shows the USA500 implied Volatility index along with USA500 index performance prior and post the Election Day based on the election since 1988 with 2008 recession year excluded. This chart interestingly suggests that typically the USA500 tends to eased/consolidate a bit a month prior elections despite an extremely high volatility, while USA500 price continues its upwards move after the election day even though volatility declines significantly.
Click here to access the Economic Calendar
Andria Pichidi
Market Analyst
Disclaimer: This material is provided as a general marketing communication for information purposes only and does not constitute an independent investment research. Nothing in this communication contains, or should be considered as containing, an investment advice or an investment recommendation or a solicitation for the purpose of buying or selling of any financial instrument. All information provided is gathered from reputable sources and any information containing an indication of past performance is not a guarantee or reliable indicator of future performance. Users acknowledge that any investment in Leveraged Products is characterized by a certain degree of uncertainty and that any investment of this nature involves a high level of risk for which the users are solely responsible and liable. We assume no liability for any loss arising from any investment made based on the information provided in this communication. This communication must not be reproduced or further distributed without our prior written permission.