


The Krona is still lagging.
The Swedish currency Krona might not be as familiar as it sounds. The Krona movement is still far behind other types of currencies. Most of the data releases scheduled next week have little effect on SEK, and while there may be some possible attention to retail sales, the impact may still be relatively weak. What is interesting is the movement of Krona, in relation to the European data towards the end of the week which could potentially move the USDSEK or EURSEK pair due to the Krona’s sensitivity to European sentiment.
Like other high beta currencies, news about coronavirus will determine most of the dynamics in the near future. Although lagging with other major currencies, next week’s movements seem to have a pretty good prospect of a rally for the USDSEK pair.
The beta of an investment measures its sensitivity to market returns. Unlike in equities, in FX the relevant benchmark for a beta cannot be a long-only index. Instead, an FX-specific beta can be based on common types of currency strategies, such as carry and trend. Currency betas measured against such benchmarks can be valuable for portfolio construction and measuring positioning risk.
Technical USDSEK
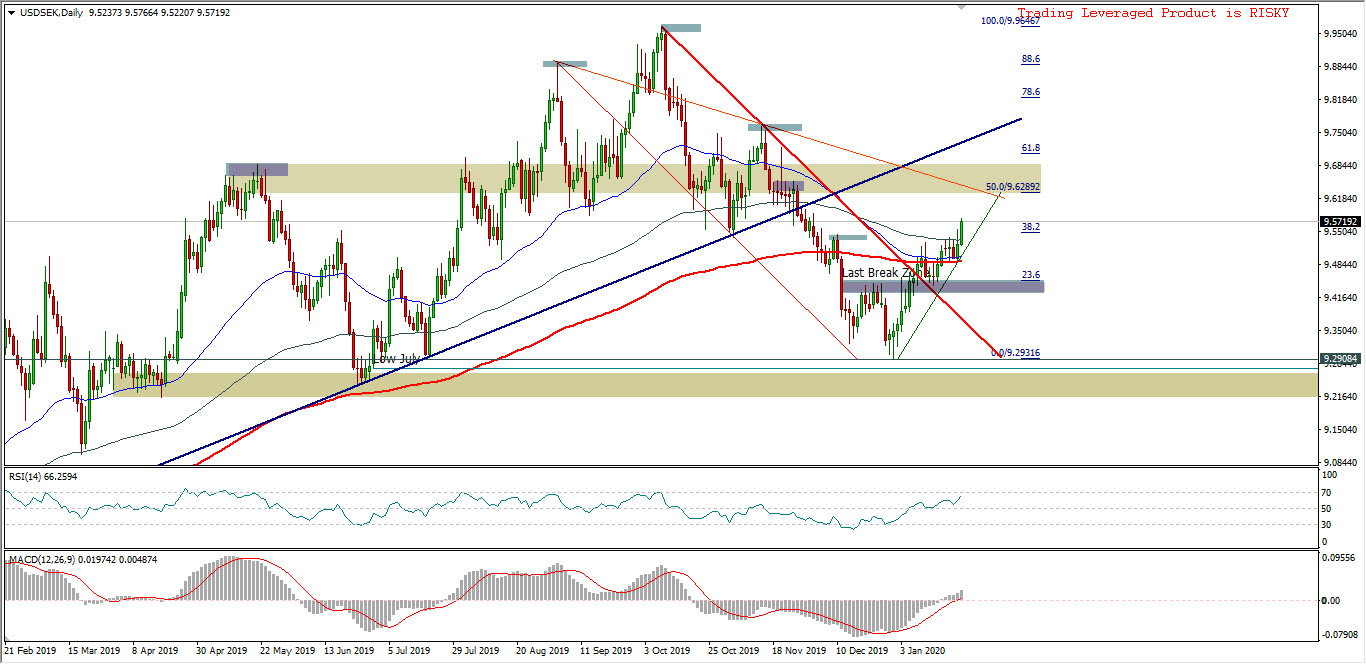 USDSEK, Daily Chart.
The rally of this currency pair has been well confirmed, with a Breakout of the descending trendline, already. The price position is above the MA slope of 50-,120- and 200-day SMA. RSI in the positive sentiment zone, while MACD is in the buy zone and retracing around 38.2%.
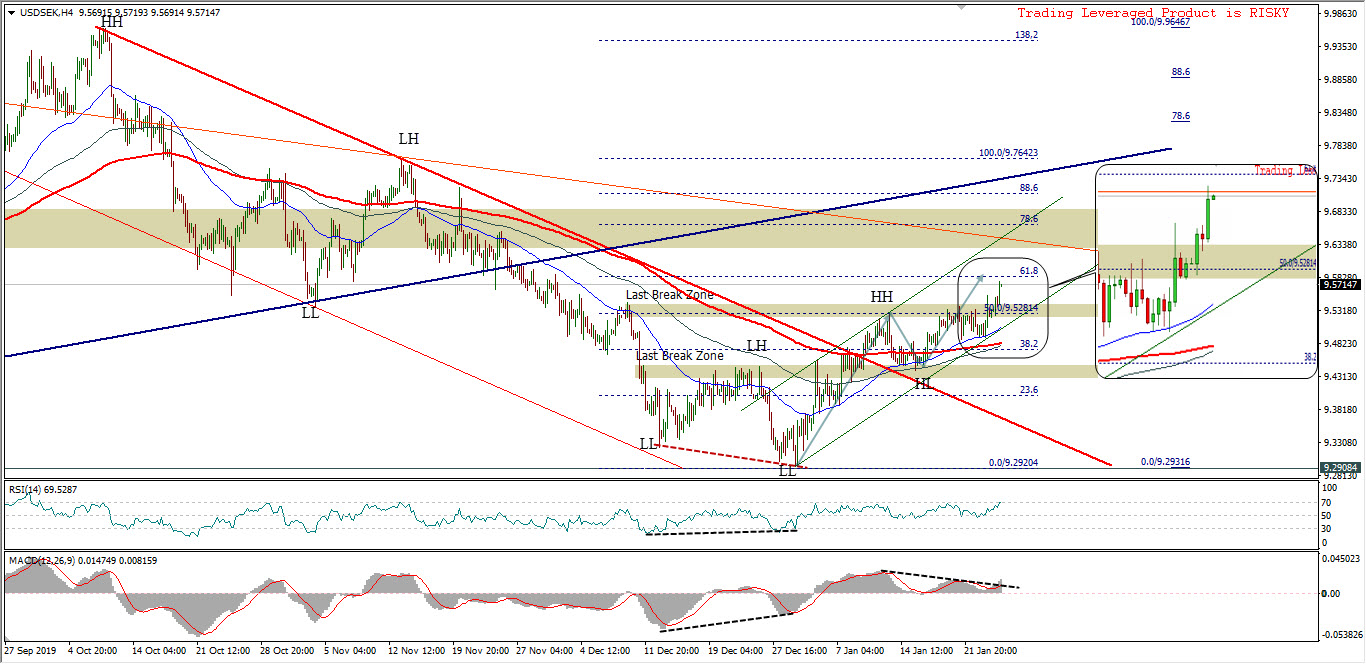 USDSEK, Hourly Chart.
The appearance of the 4-hour chart built a pretty good price construction, in addition to its dynamically rising structure, the price has also broken out 2 horizontal resistance levels at 9.4411 / 9.5444, as well as the diagonal resistance of the descending trendline.
Using the candlestick formation above 3 MA as a price indicator, RSI and MACD are seen supporting the price movement to the north. If this rally continues, the reference resistance will be at the level of 50.0% or 61.8% of the Fib. retracement, from the high prices in October 2019 and the low prices in December 2019. If a correction occurs from the rising wave then the price will likely return to the last resistance crossed which is at the 23.6% Fib. level.
Ady Phangestu
Market Analyst – HF Educational Office – Indonesia
Disclaimer: This material is provided as a general marketing communication for information purposes only and does not constitute an independent investment research. Nothing in this communication contains, or should be considered as containing, an investment advice or an investment recommendation or a solicitation for the purpose of buying or selling of any financial instrument. All information provided is gathered from reputable sources and any information containing an indication of past performance is not a guarantee or reliable indicator of future performance. Users acknowledge that any investment in Leveraged Products is characterized by a certain degree of uncertainty and that any investment of this nature involves a high level of risk for which the users are solely responsible and liable. We assume no liability for any loss arising from any investment made based on the information provided in this communication. This communication must not be reproduced or further distributed without our prior written permission.


