


Easing has limited impact
The overall tariffs imposed by the US on Chinese products remain, with 25% tariffs on $360 billion of imports. If all goes according to plan, Trump will visit Beijing in February to begin negotiations for the next phase.
China’s central bank has announced that it will cut the broad-based reserve requirement ratio (RRR) by 0.5 points in January to meet massive loan demand at the beginning of the year. The PBoC is expected to inject liquidity through open market operations, including MLF, to facilitate tightening ad-hoc liquidity. All this easing of monetary policy might have a limited impact on the Yuan, as the Yuan is more reactive to news about trade wars and technological wars.
It is ideal to have one or two cuts in interest rates, but if the risks ahead continue, the PBoC is likely to maintain a more relaxed monetary policy next year. Whereas for this year, PBoC is expected to continue to use interest rates and liquidity policy tools to maintain economic stability.
Yuan recorded a historic increase in July to September last year, with a peak price of 7.1961 against the USD. At that time, Trump accused China of manipulating its currency by deliberately downplaying its exchange rate to anticipate American tariff policies.
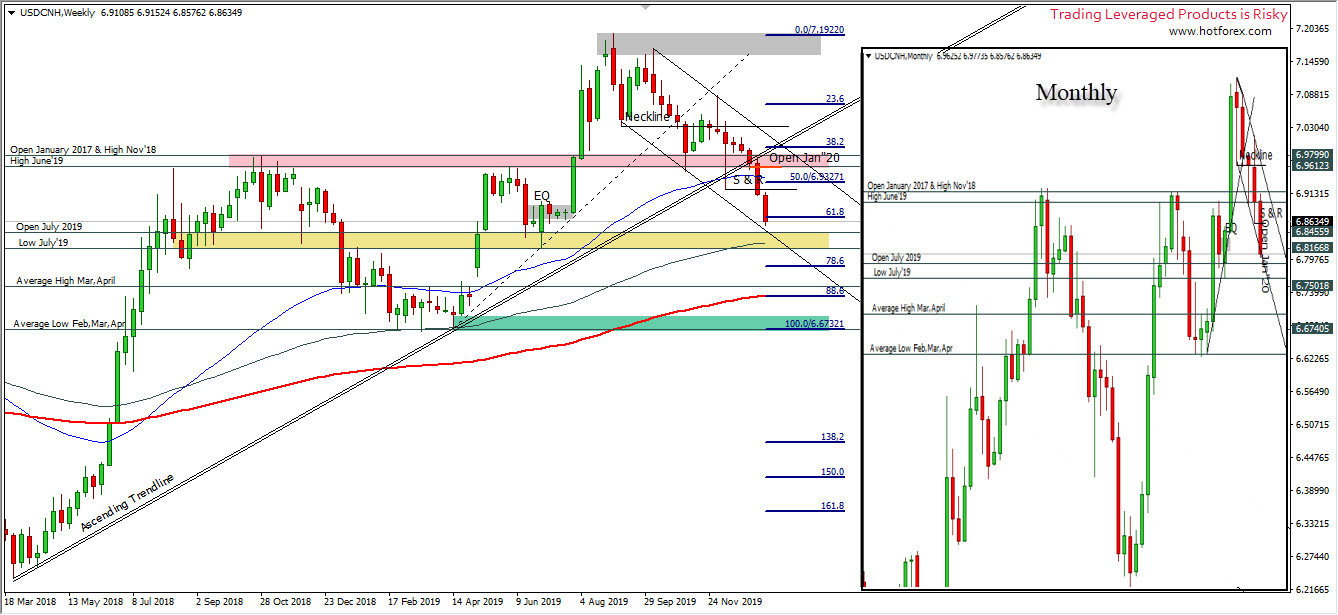
Technically, on the weekly period chart view, USDCNH has experienced a shift in interest marked by a major ascending trendline breakout, while prices have corrected at 61.8% Fibonacci retracement level and are approaching the opening price in July 2019 at 6.8468 with the low price of 6.8161. Last week the price formed a low at 6.8576 and closed at 6.8635.
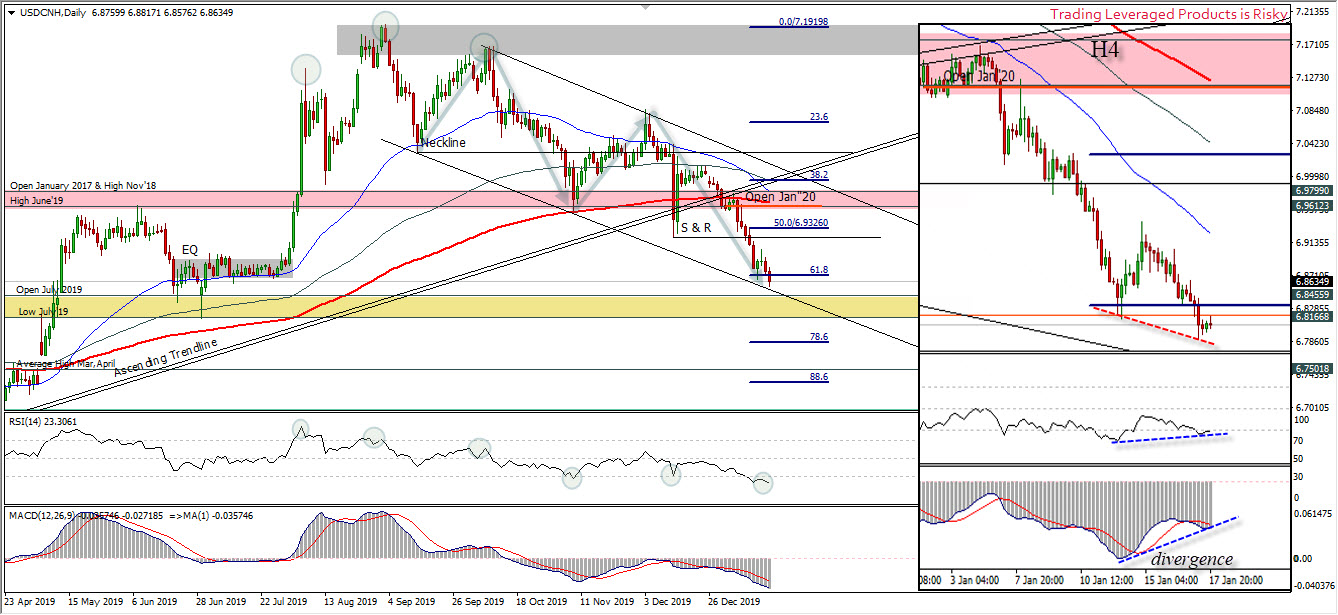
Technically, in the daily period, a bearish wave structure is seen which is marked by the emergence of expectations of the first phase of the trade agreement. The price seems to be stuck in the area of past equilibrium consolidation which was formed at the end of June to mid-July last year. The downward channel looks conservative, forming a balanced level of Support and Resistance in the slope bias. The price is under the auspices of the MA 50-, 120- and 200-day SMA, the RSI shows oversold and the MACD area is still at the end of the sell zone and has not provided an indication of a change for a while.
Meanwhile, in the 4-hour period, a divergence pattern emerged which was clearly recorded by the lower low in the price action with higher low in the RSI and MACD graphs.
Ady Phangestu
Market Analyst – HF Educational Office – Indonesia
Disclaimer: This material is provided as a general marketing communication for information purposes only and does not constitute an independent investment research. Nothing in this communication contains, or should be considered as containing, an investment advice or an investment recommendation or a solicitation for the purpose of buying or selling of any financial instrument. All information provided is gathered from reputable sources and any information containing an indication of past performance is not a guarantee or reliable indicator of future performance. Users acknowledge that any investment in Leveraged Products is characterized by a certain degree of uncertainty and that any investment of this nature involves a high level of risk for which the users are solely responsible and liable. We assume no liability for any loss arising from any investment made based on the information provided in this communication. This communication must not be reproduced or further distributed without our prior written permission.
Peringatan Risiko : Perdagangan Produk dengan Leverage seperti Forex dan Derivatif mungkin tidak cocok bagi semua investor karena mengandung risiko tingkat tinggi atas modal Anda. Sebelum melakukan perdagangan, harap pastikan bahwa Anda memahami sepenuhnya kandungan risiko yang terlibat, dengan mempertimbangkan tujuan investasi dan tingkat pengalaman Anda dan bila perlu carilah saran dan masukan dari pihak independen.


