Risk appetite improved during the Asian session and stock markets moved broadly higher. European stock markets are also up and they are moving higher, with GER30 and UK100 currently up by 0.73% and 0.59%.
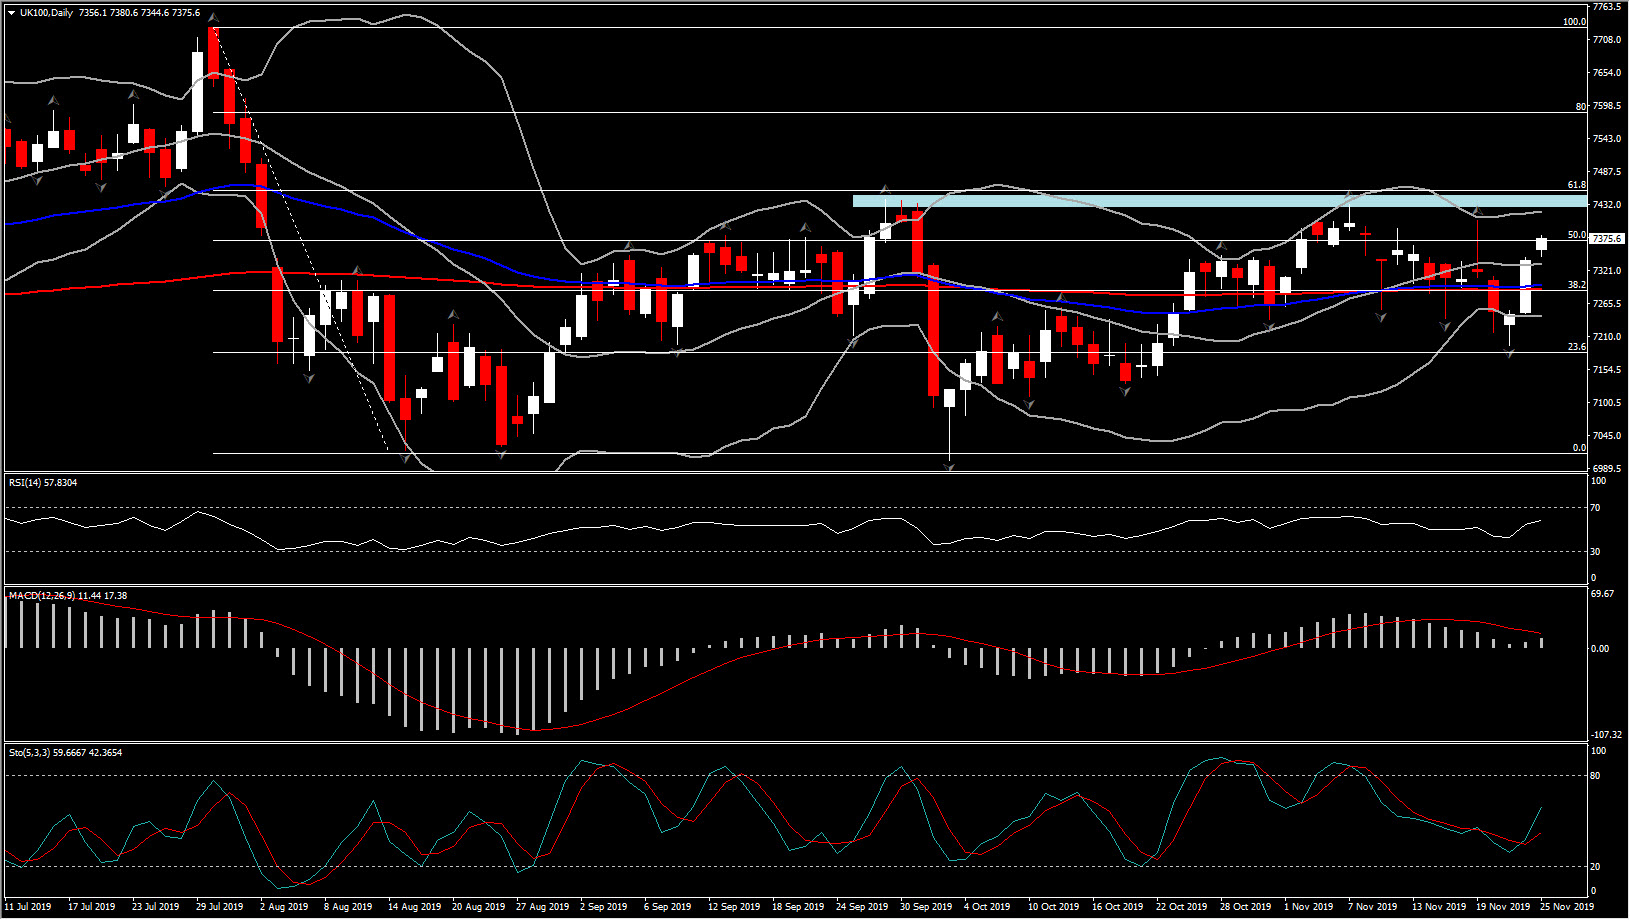
UK100
The latest opinion polls for the U.K. election confirmed the leading position for the Conservative Party, which together with a manifesto that pledged “responsible” tax and spending plans, boosted the Pound and FTSE. Friday’s close above all daily Moving averages, by nearly mover than 80 pips, suggesting an increasing positive bias. Momentum indicators on the daily chart took a mild boost presenting further upside potential however a limited one, until the 7,430-7,450 area. The latter is a 4-month Resistance area which coincides with the 61.8% Fib. retracement level since August dip. Hence the asset could retest and retraced on this area.
JPY: Softer amid risk-on
|
Asset
|
Daily bias | Day’s Range |
|---|---|---|
|
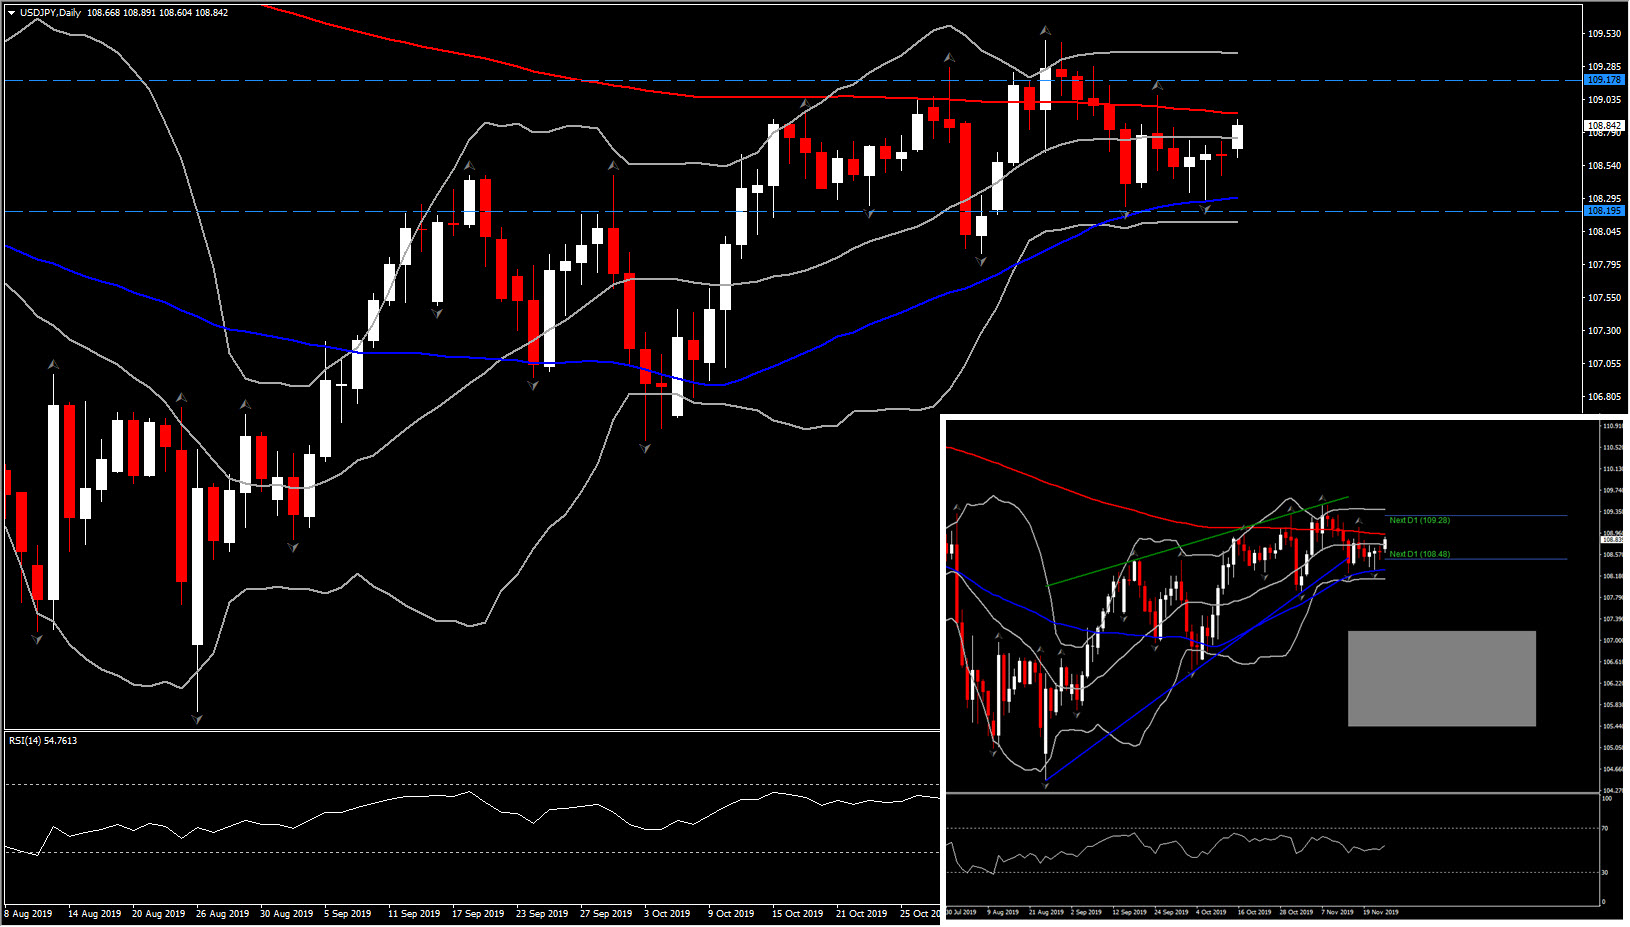
USDJPY – 108.80
|
Neutral | 108.48 – 109.28 |
- Beijing pledged new measures to protect intellectual property. While many market narratives have a fatigued tone after repeated and often banal rhetoric with regard to progress being made 6 weeks after the “phase 1” deal was announced, the fact that neither side has walked away seems to show there is commitment. A key test looms, with the US scheduled to hike tariffs on $156 bln of of largely technology imports from China. Reuters suggests that the indications are that these tariffs will be delayed to give negotiators more time. Both US and Chinese officials and trade experts cited by Reuters suggest that a more expansive “phase 2” deal is not looking viable, however. Despite this, and a strong pro-democracy result in Hong Kong’s council elections, markets have been happy to run with a risk-on theme for now.
- The yen has weakened amid risk-on trading. USDJPY lifted to a 1-week high at 108.89 on the back of Yen underperformance, just a breath below the 200-day SMA. AUDJPY which is the key risk appetite indicator, has lifted overnight above its Friday peak in making 74.00, but quickly reversed some of these gains so far. USDJPY on the other hand has not retrace gains yet but has stuck at 108.80 area, with moving averages looking ready to form a bearish cross intraday (50- and 200-period SMA , in H4), with immediate Support at 108.65-108.70. In the daily chart meanwhile, the move below the ascending triangle presents a longterm negative outlook, however the flattening of all 3 daily SMA along with the choppy Bollinger BAnd lines suggest that for now the medium term the asset is expected to keep consolidating within 108.20-109.20.

EUR: Retests 50-day SMA
|
Asset
|
Daily bias | Day’s Range |
|---|---|---|
|
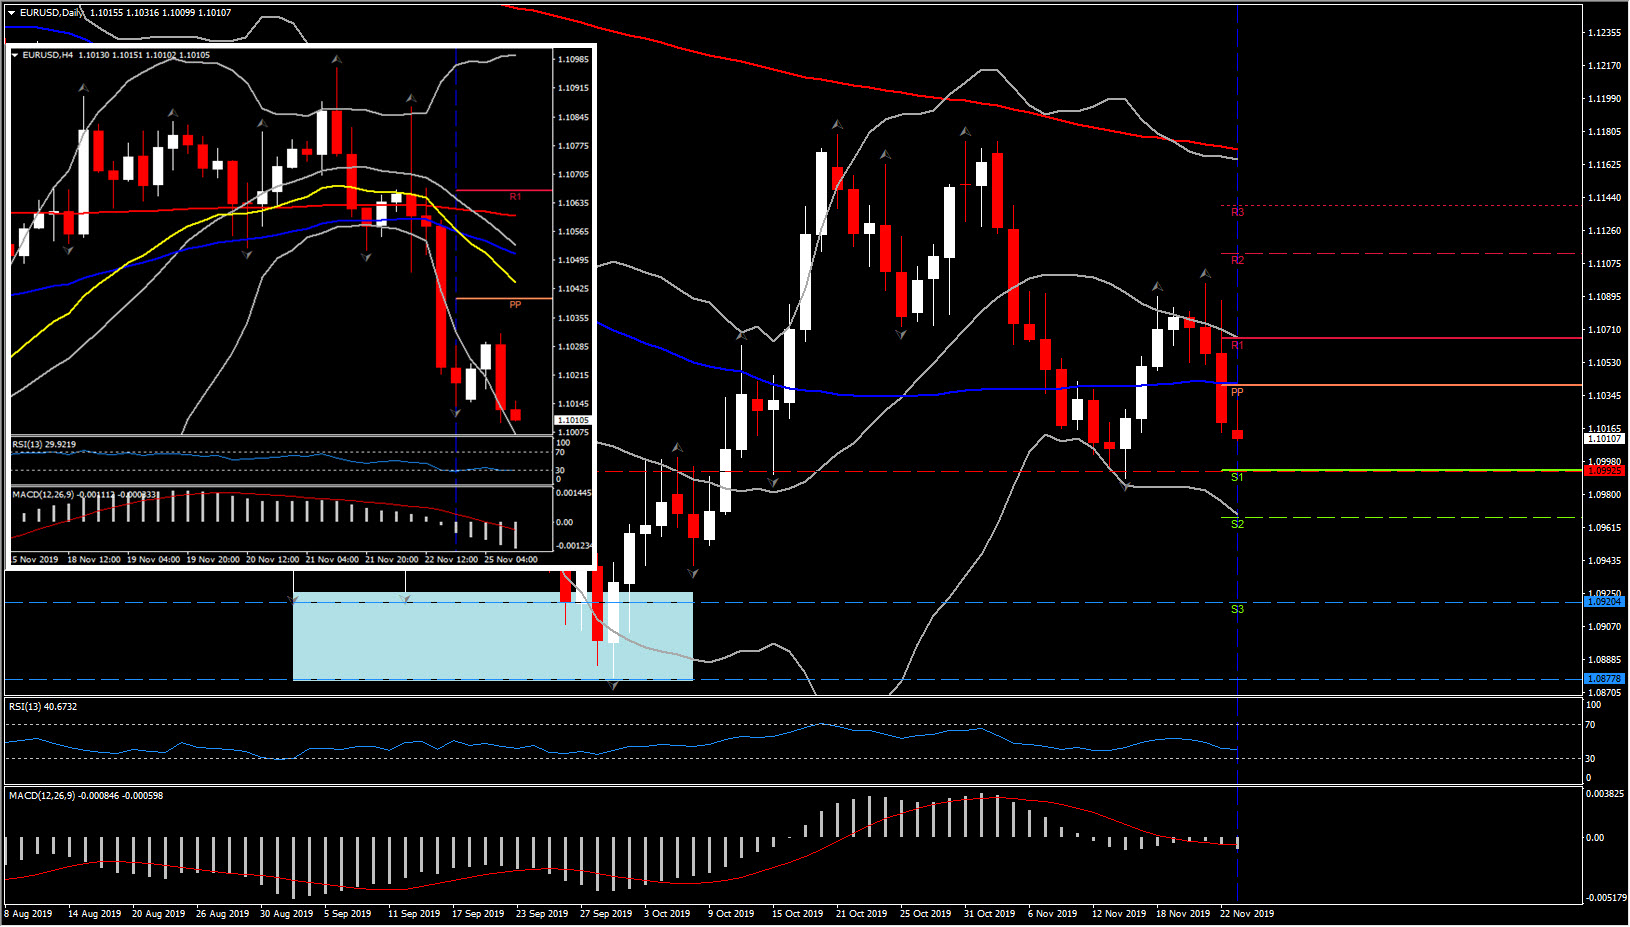
EURUSD – 1.1014
|
Bearish | 1.1026 – 1.1058 |
- EURUSD has been making time in a narrow range just above the 10-day low seen on Friday at 1.1014.As it holds well below the pivot point at 1.1040 (also 50-day SMA), and the 20-day SMA, the pair seems to facing a fresh pressure after Friday’s sell off. Momentum indicators in the daily chart are neutral to negative as both RSI and MACD lines have been flattened slightly below neutral zone. Intraday however have turned lower. If this move lower sustained and breaks the Support of 1.099, this might open the gates for September lows at 1.0878-1.0920.
CAD: Remains buoyant
| Asset | Daily bias | Day’s Range |
|---|---|---|
|
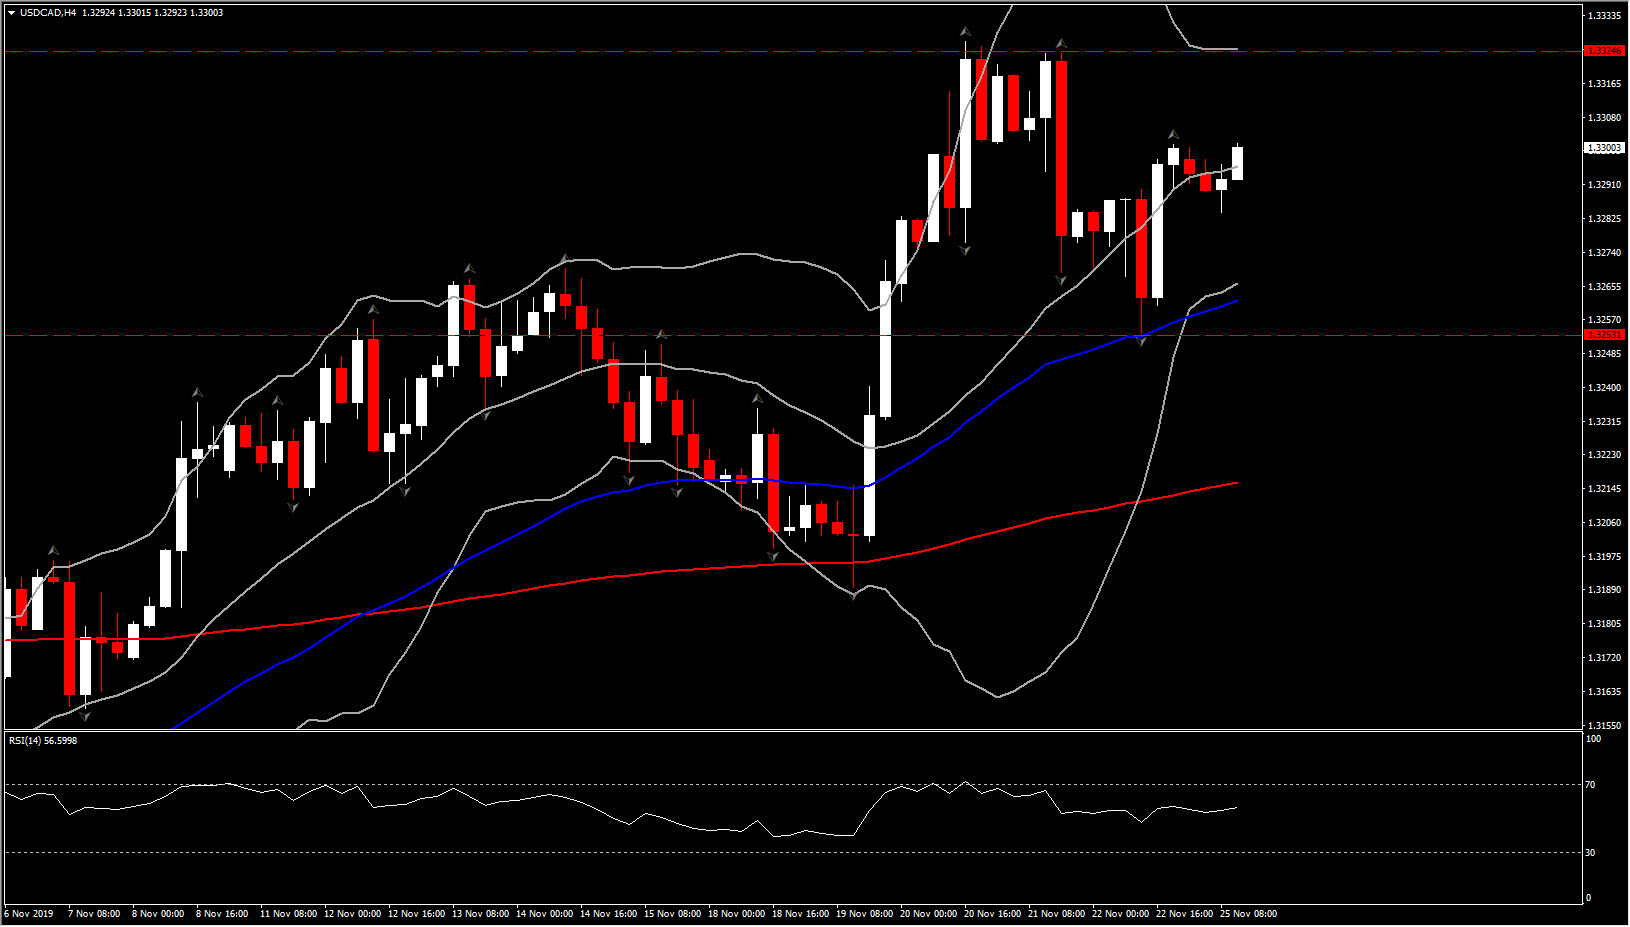
USDCAD 1.3300
|
Bullish | 1.3254-1.3324 |
- USDCAD has traded moderately softer today as the Canadian Dollar, and its dollar-bloc brethren, find some Support against a risk-on backdrop in global markets after Beijing announced new measures to protect intellectual property. Oil prices having been trading steadily, near to levels seen a week ago following a sharp down-then-back-up price action during the middle part of last week.
- While softer on the day, USDCAD remains above the 6-day low seen on Friday at 1.3254. The low was seen after BoC Governor Poloz stated that interest rates are “about right,” which was taken as a partial walk-back of recent dovish signalling from the central bank. At prevailing levels USDCAD is trading near to the midway point of a broadly sideways range that’s been seen since July 2018. More of the same looks likely.
Click here to access the HotForex Economic Calendar
Andria Pichidi
Market Analyst
HotForex
Disclaimer: This material is provided as a general marketing communication for information purposes only and does not constitute an independent investment research. Nothing in this communication contains, or should be considered as containing, an investment advice or an investment recommendation or a solicitation for the purpose of buying or selling of any financial instrument. All information provided is gathered from reputable sources and any information containing an indication of past performance is not a guarantee or reliable indicator of future performance. Users acknowledge that any investment in Leveraged Products is characterized by a certain degree of uncertainty and that any investment of this nature involves a high level of risk for which the users are solely responsible and liable. We assume no liability for any loss arising from any investment made based on the information provided in this communication. This communication must not be reproduced or further distributed without our prior written permission.